A stock picker’s portfolio
Investing in stocks is a three-step process. Where to look, the valuation, the story. Then construct a stock portfolio, possibly by investment strategy. Each week a stock portfolio is constructed based on Final Trades. On a daily basis stocks are discussed on CNBC’s program Halftime Report. Individual stock selection is by a panel of professional investment managers.

The portfolio is designed to be concentrated in the number of stocks but diversified by sector. It is a stock picker’s portfolio. The stocks selected for the portfolio will be largely based on their selections. Other stocks can be included based on the investment profile of the stock. As well as, Exchange Trades Funds (EFTs).
PORTFOLIO CONSTRUCTION: 10 STEP PROCESS
The portfolio construction process is a straight-forward 10 step process.
Select individual stocks to be included. U.S stocks, selectively ETFs.
Measure the market cap of the stocks in the portfolio.
Aggregate individual market cap for a total market cap of the portfolio.
By market cap, calculate percentage contribution for each stock, ETFs 5%.
Estimate the individual allocation for each stock.
Mega cap 15%, Large cap 10%, Mid-cap 5%, EFTs 5%.
The initial allocation is a proforma (not real) amount of $1,000,000.
Based on the initial investment, calculate the allocation to each stock.
Determine the number of shares. Allocation divided by share price.
Construct the portfolio in Finscreener under “my portfolios”.
CNBC - FINAL TRADES
Investing in Stocks: Portfolio 01 – 01/20/23
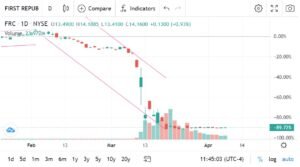
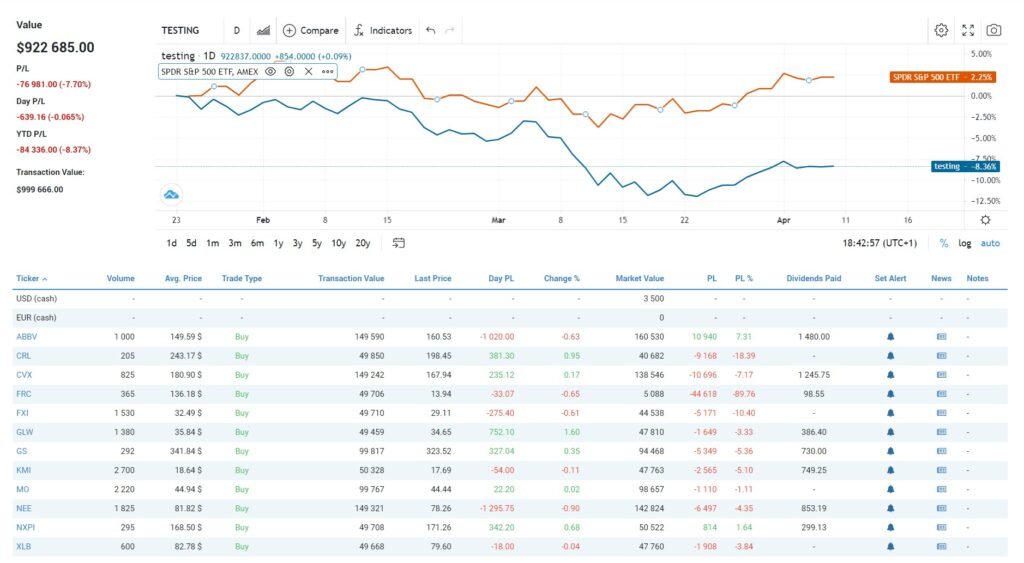
The portfolio was invested on 20 January. Over the duration of the portfolio, performance was down 8.4%. The main drag on performance was First Republic Bank, plummeting 90% in value. In Q1, the U.S. regional banking sector suffered a server sell off. This was in reaction to the collapse of Silicon Valley Bank. Ultimately, the financial crisis, which emerged in March, has been contained. There was a massive contagion effect which impacted First Republic Bank (FRG).
Investing in Stocks: Asset Allocation
The portfolios asset allocation remains diversified. The Állocation Graph states “Other” at 23%, which to clarify are the two ETF exposures. One is the China Large-Cap ETF at 4.8%, down 9% over the period. The other is the Materials Select Sector SPDR at 5.2%, down 2% over the period. The main sector exposures at 15.4% weighting are, Healthcare, Energy and Technology.

Investing in Stocks: Price Potential
The Consensus Graph measures the suggested investment strategy by analysts following the stock. As indicated on the Overall Consensus graph, 82% of the portfolio’s exposure is a Strong Buy. Considering the two EFT exposures are not rated, this means that all the stock at in fact rated as Strong Buys. The stock rated with the greatest potential upside is FRC at 9X. This is due to the extenuating circumstances discussed above. At this point, FRC share price is not going to appreciate 9X.

The stocks with the highest potential price target as set by the analytical community are as follows. The stock with the highest potential upside is Charles River + 42%. CRL operates Healthcare specifically in Medical Diagnostics & Research and is discussed below. Then Goldman Sachs (GS) Banks +25% and NextEra Energy Utilities +20%. AbbVie (ABBV) has been the best performing stock over the period. ABBV now has an upside potential of +2% and operates in Healthcare.

STOCK: HIGHEST POTENTIAL UPSIDE
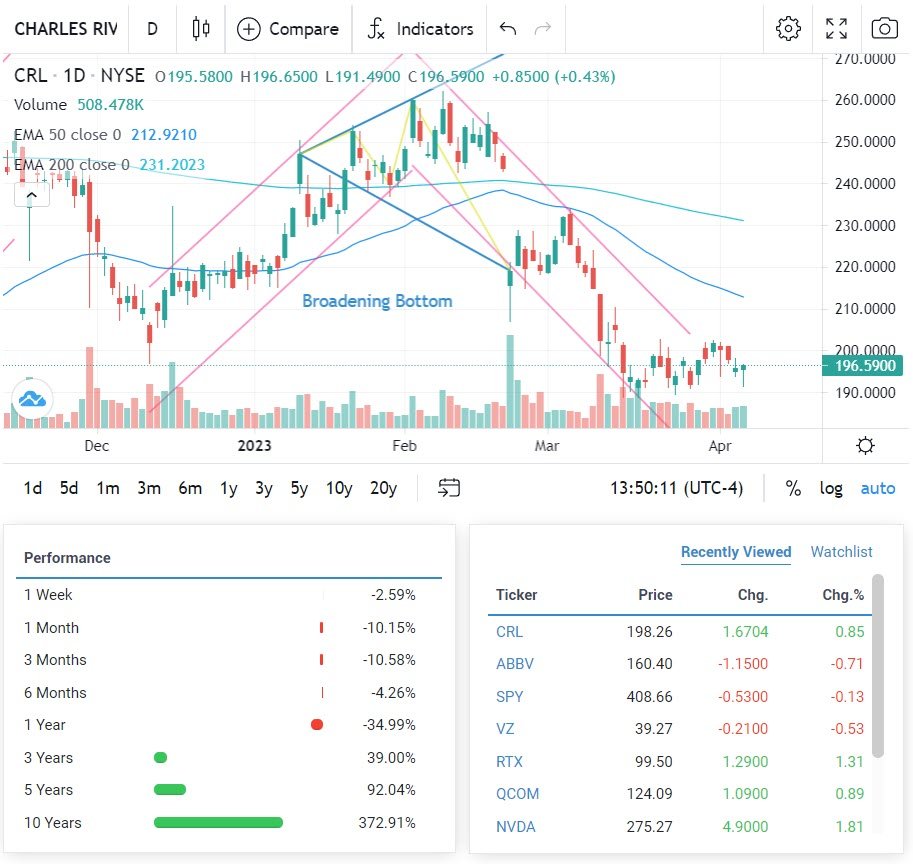
CHARLES RIVER LABS (CRL)
CRL is active throughout the pharmaceutical and biotechnology research and development value chain. Outsourcing of aspects of drug development by multinational pharmaceutical companies has become common place. Big Pharma have boosted their Biotech funding through venture capital funds. As a result, growth in the contract research organization (“CRO”) market has accelerated. Because biotechnology businesses lack the means to establish their own R&D facilities, they outsource substantial sections of their activities to CROs such as CRL.
CRL has the potential to grow organically in the mid-teen percent range for several years. This growth is driven by the increasing trend to outsource and increased investment in biotech. CRL has also complemented organic expansion with acquisitions, which have allowed the company to obtain exposure to emerging therapies and trends. Accretive acquisitions, combined with organic growth and their business model, should result in solid EPS growth. The projected estimate for EPS growth is in the mid-teens over the mid-term.

Investing in Stocks: Dividends and performance

STOCK: BEST PERFORMANCE
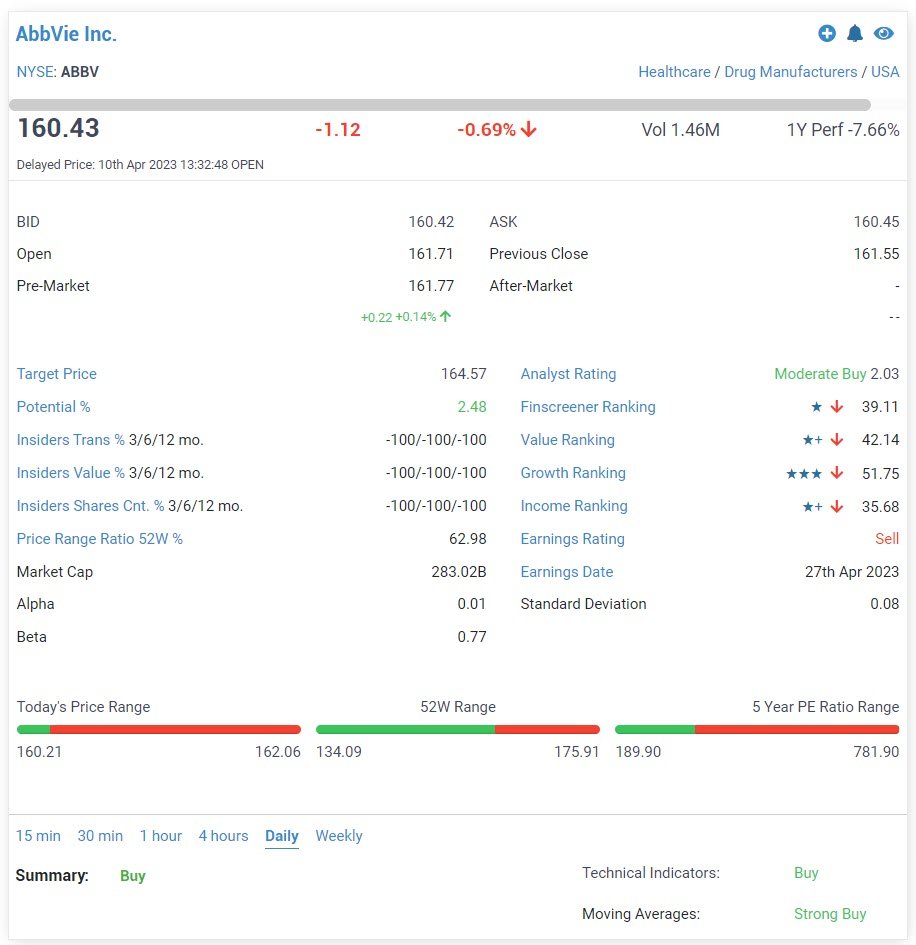
AbbVie (ABBV)
AbbVie is a multinational pharmaceutical business. The group is focused on the development of medications in immunology, cancer, neuroscience, and virology. It is headquartered in North Chicago, Illinois. AbbVie has a medication pipeline, receiving fast track approvals for drugs to treat various illnesses. Illnesses such as mantle cell lymphoma and marginal zone lymphoma. AbbVie has been working on the development of antibody-drug conjugates for a variety of disorders.
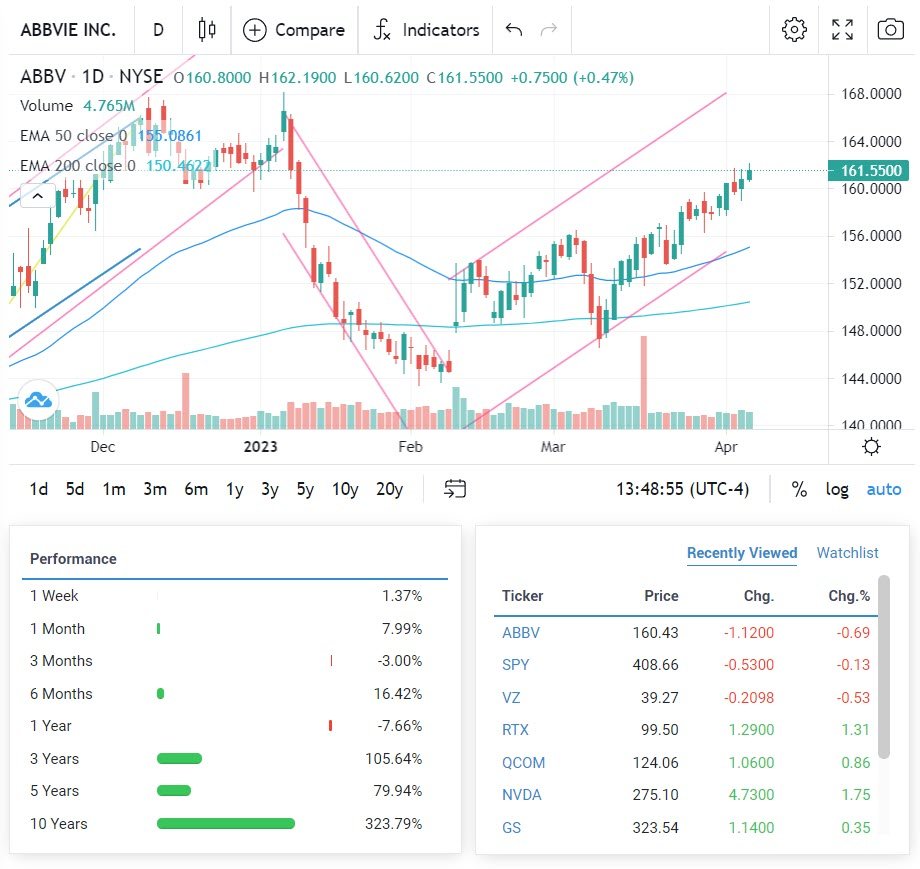
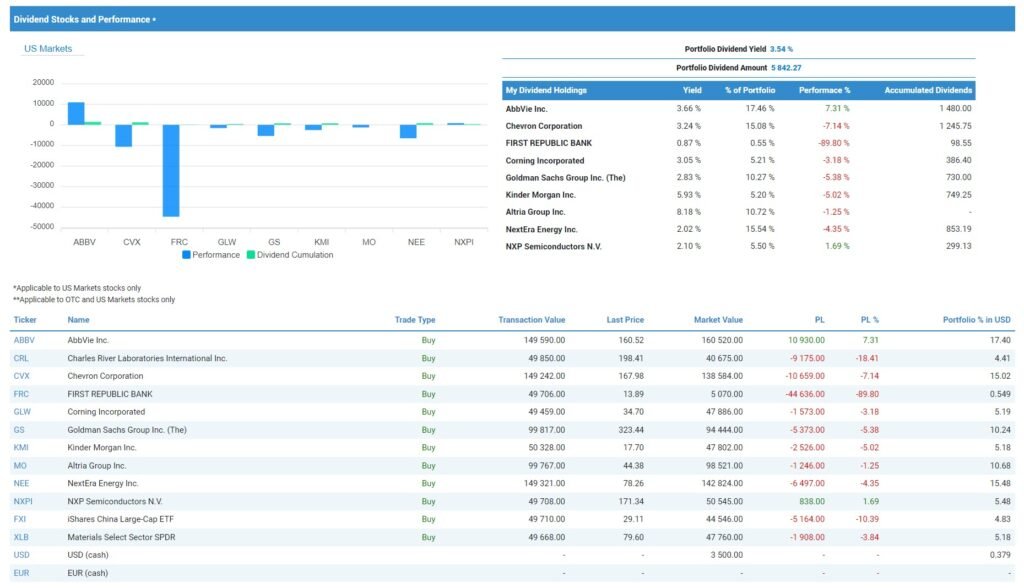
YoY AbbVie (ABBV) is down 5.03%, YTD down 0.2%. ABBV stock has a five-year performance of 72.23%. Its 52-week range is between $134.09 and $175.04, which gives ABBV stock a 52-week price range ratio of 68.50%
AbbVie Inc. current PE ratio is 355.80X, a price-to-book (PB) ratio of 18.42X, and a price-to-sale (PS) ratio of 6.66X. The ROA is 9.98%, and a ROE of 97.14%. The company’s profit margin is 21.83%, its EBITDA margin is 43.80%. The stock price has limited upside from here.
