Portfolio 17 – best performer and greatest upside
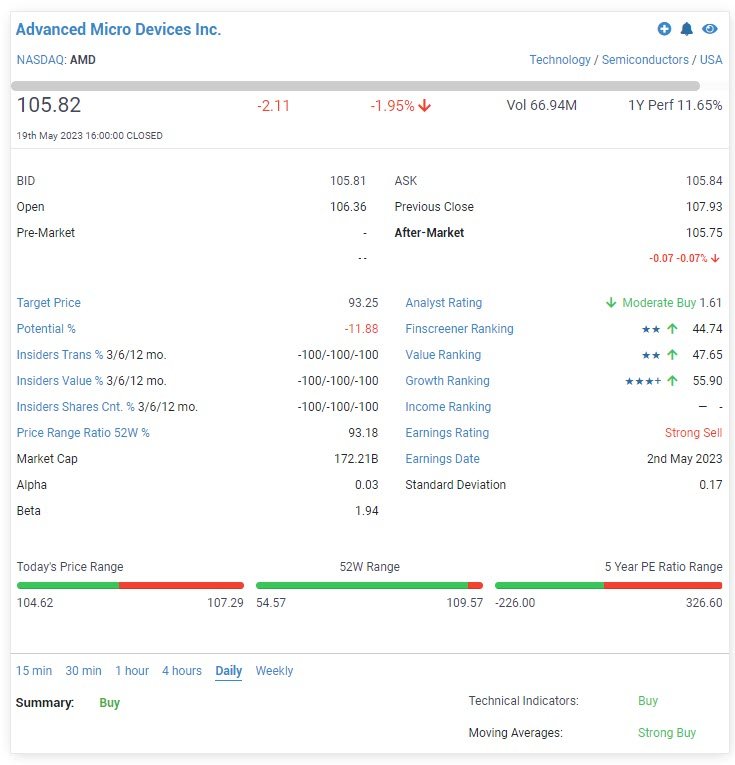
Portfolio 17 was launched after the week ending on 12 May, and the performance is +2.6%. The portfolio’s performance has been boosted by the 11% rise over the week of Advanced Micro Devices (AMD). Equity analysts following AMD have a 12-month median price target is $93. This is around 10% below where the stock is currently trading at $103. The highest price target, $200, probably is optimistic, and the lowest estimate is $60.00.
For subscribers who would like to take a look at Portfolio 16, click HERE.
STOCK: HIGHEST POTENTIAL UPSIDE
DEVON ENERGY (DVN)
Devon Energy, headquartered in Oklahoma City, is one of North America’s major independent exploration and production businesses. The firm’s asset portfolio spans onshore North America, including exposure to the Delaware, STACK, Eagle Ford, Powder River Basin, and Bakken plays. Devon’s proven reserves were 757 million barrels of oil equivalent by the end of 2020.
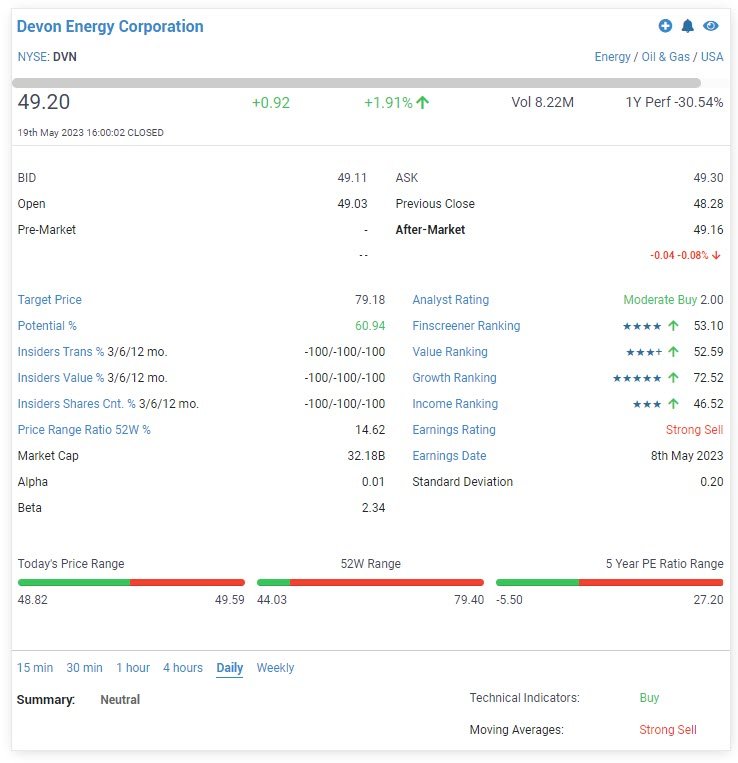
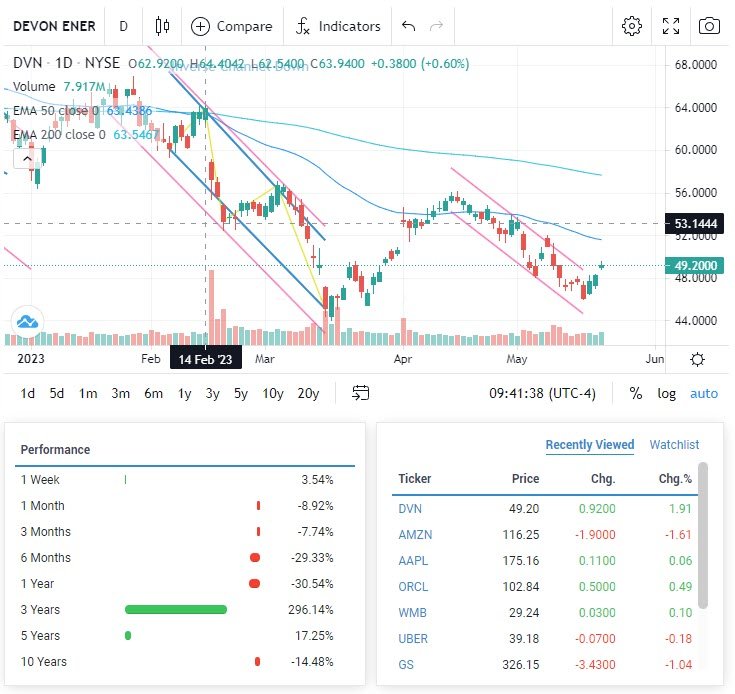
YOY Devon Energy Corporation stock is down -30.54%, YTD performance is -20.01%. DVN stock has a five-year performance of 17.25%. Its 52-week range is between $44.03 and $79.40. DVN stock has a 52-week price range ratio of 14.62%.
DVN is currently trading on a PE ratio of 6.40X, a price-to-book (PB) ratio of 3.68X, a price-to-sale (PS) ratio of 2.73X. The ROA is 30.35%, and a ROE of 68.15%. The company’s profit margin is 32.50%, its EBITDA margin is 54.50%.


DEVON ENERGY (DVN)
Devon Energy, headquartered in Oklahoma City, is one of North America’s major independent exploration and production businesses. The firm’s asset portfolio spans onshore North America, including exposure to the Delaware, STACK, Eagle Ford, Powder River Basin, and Bakken plays. Devon’s proven reserves were 757 million barrels of oil equivalent by the end of 2020.

YOY Devon Energy Corporation stock is down -30.54%, YTD performance is -20.01%. DVN stock has a five-year performance of 17.25%. Its 52-week range is between $44.03 and $79.40. DVN stock has a 52-week price range ratio of 14.62%.
DVN is currently trading on a PE ratio of 6.40X, a price-to-book (PB) ratio of 3.68X, a price-to-sale (PS) ratio of 2.73X. The ROA is 30.35%, and a ROE of 68.15%. The company’s profit margin is 32.50%, its EBITDA margin is 54.50%.
Finscreener is a powerful financial analysis tool that allows investors and traders to screen and analyze stocks, ETFs, mutual funds, and cryptocurrencies based on various fundamental and technical criteria quickly and easily. The platform provides users with a wide range of filters, charts, and tools to help them find and analyze the right investment opportunities.
SUBSCRIBER TO FINSCREENER, CLICK BELOW
STOCK: BEST PERFORMANCE
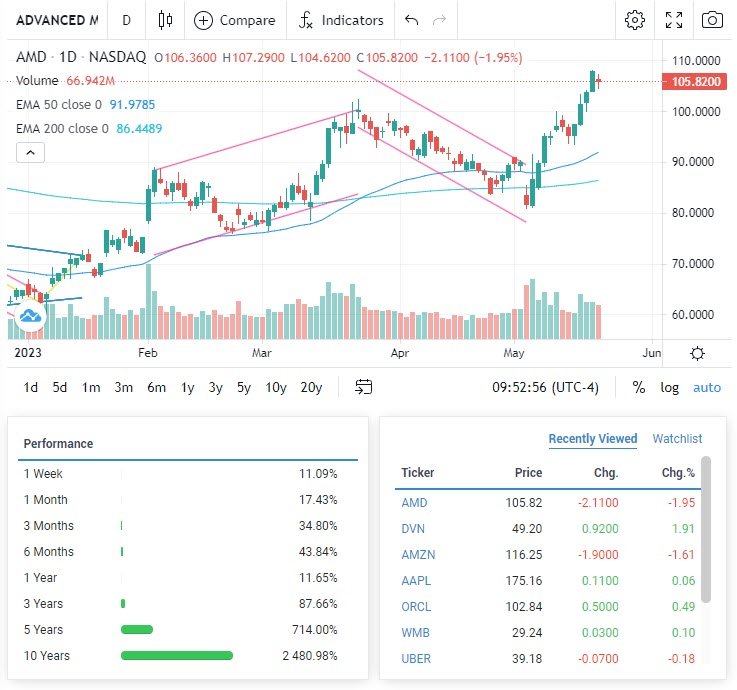
ADVANCED MICRO DEVICES (AMD)
AMD has led the way in high-performance computing, graphics, and visualization technologies, for over 50 years. These functions serve as the foundation for gaming, immersive platforms, and data centres. Hundreds of millions of consumers, Fortune 500 companies, and cutting-edge scientific research centres worldwide rely on AMD technology on a daily basis to improve how they live, work, and play. AMD personnel all over the world are working hard to create excellent products that push the boundaries of what is possible.
YOY, the AMD stock is up 11.65%, YTD performance is +63.38%. AMD stock has a five-year performance of 714%. Its 52-week range is between $54.57 and $109.57, which gives AMD stock a 52-week price range ratio of 93.18%.
Advanced Micro Devices Inc. currently has a PE ratio of 38.50X, a price-to-book (PB) ratio of 1.89X, a price-to-sale (PS) ratio of 6.02X, a price to cashflow ratio of 24.60X. The ROA of 5.88%, and the ROE of 7.50%. The company’s profit margin is 7.22%, its EBITDA margin is 25.20%.
Follow, learn and maybe gain some investment ideas trading with EToro. The platform has over 30 million traders and investors. Invest in 3,000+ assets on a trusted and friendly platform.
77% of retail investor accounts lose money when trading CFDs with this provider


