A stock picker’s portfolio
How to invest in stocks by constructing a simple stocks portfolio. Finding a quick, easy-to search or screen for stocks is key to this process. Each week a portfolio is constructed based on Final Trades. The socks are discussed daily on CNBC’s program Halftime Report. The selection is made by a panel of professional investment managers.
The portfolio is designed to be concentrated by the number of stocks. But diversified by sector. It is a stock picker’s portfolio, to provide a broad range of stocks. The stocks selected will be largely based on the selections of the panelists. Other stocks can be included based on the investment profile of the stock. Sometimes the panel may recommend broad sector or geographic expoThusan EFT. Thus, ETFs can be included at a 5% weighting.
PORTFOLIO CONSTRUCTION: 10 STEP PROCESS
The portfolio construction process is a straight-forward 10 step process.
Select individual stocks to be included. U.S stocks, selectively ETFs.
Measure the market cap of the stocks in the portfolio.
Aggregate individual market cap for a total market cap of the portfolio.
By market cap, calculate percentage contribution for each stock, ETFs 5%.
Estimate the individual allocation for each stock.
Mega cap 15%, Large cap 10%, Mid-cap 5%, EFTs 5%.
The initial allocation is a proforma (not real) amount of $1,000,000.
Based on the initial investment, calculate the allocation to each stock.
Determine the number of shares. Allocation divided by share price.
Construct the portfolio in Finscreener under “my portfolios”.
![]()
CNBC - FINAL TRADES

How to Invest in Stocks: Portfolio 02 – 01/27/23
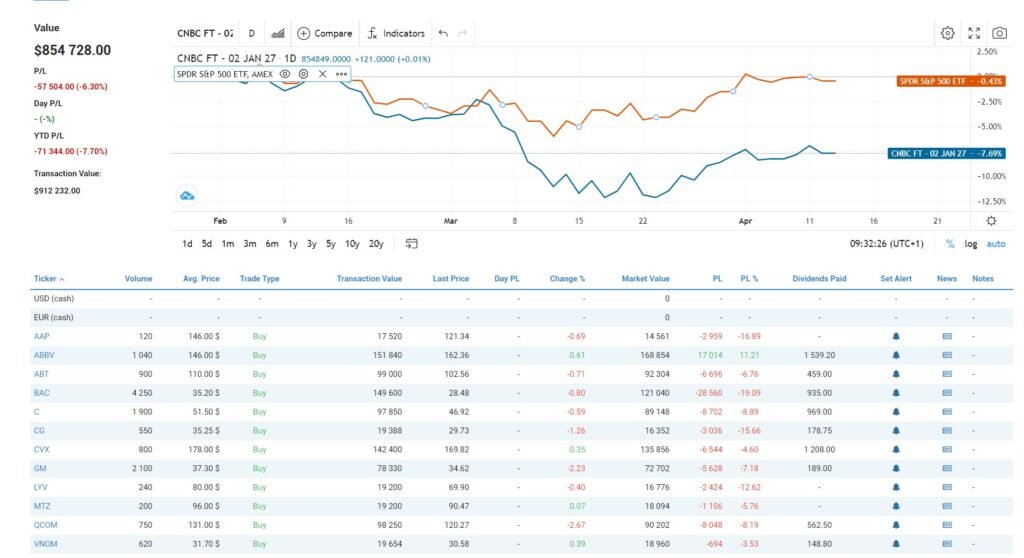
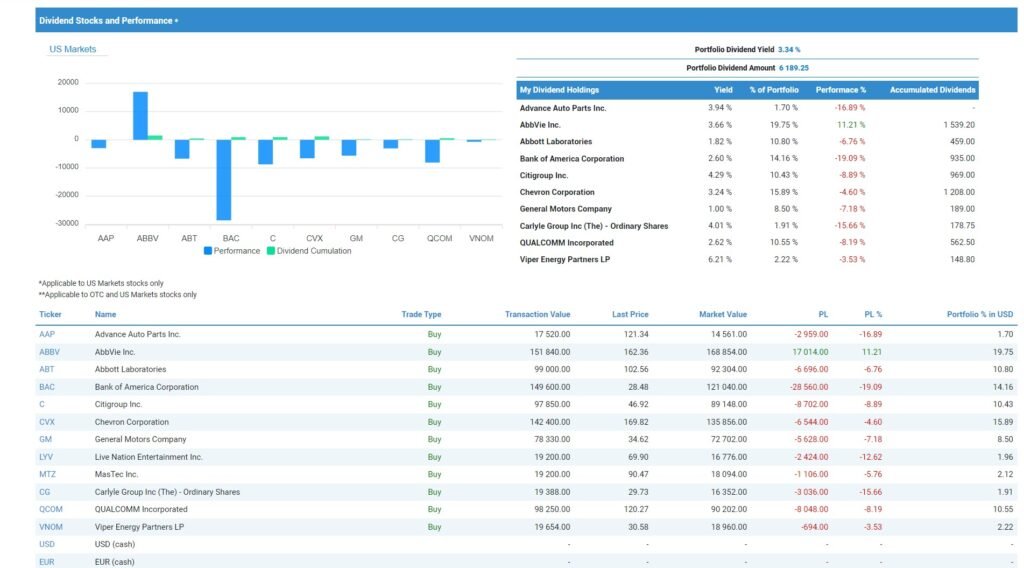
The portfolio was invested on 27 January and the portfolio is down 6.3% until today. The worst performing stock was Bank of America down 19% and Advance Auto Parts down 16.9%. Over the period, bank stocks were hit by the banking crisis.
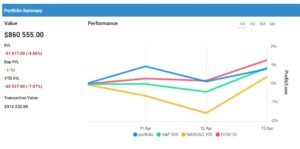
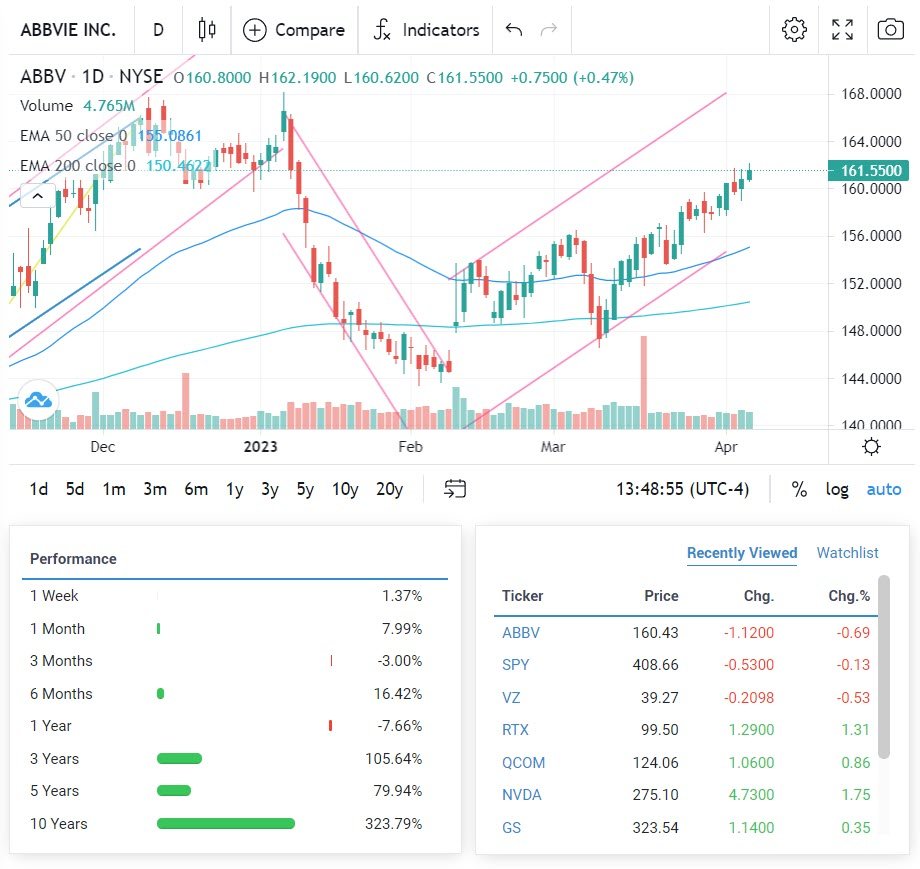
The U.S. regional banking sector suffered a server sell off, instigated by the collapse of several banks. The liquidity crisis that hit the banks has been resolved due to actions by the Fed and the FDIC. The best performing stock to date has been AbbVie +11.2%, discussed below. For more information on the Q1 bank crisis, click HERE.
SUBSCRIBE TO FINSCREENER
How to Invest in Stocks: Asset Allocation
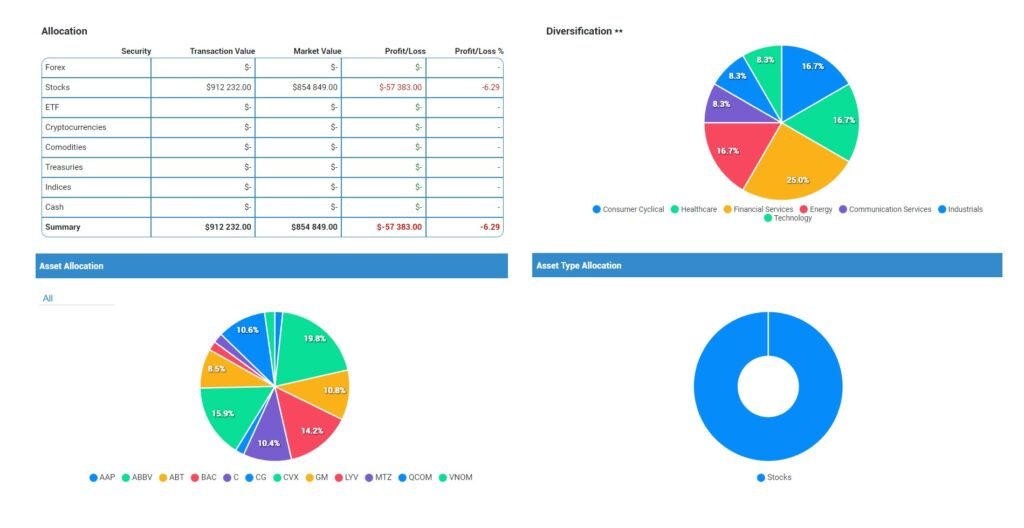
The portfolio’s asset allocation remains diversified as indicated by Allocation Graph. The largest sector weighting is financials, with the two stocks being BAC and Citi. The three other sector exposures, at 16.7%, are Healthcare, Consumer Cyclical and Energy.
How Invest in Stocks: Price Potential
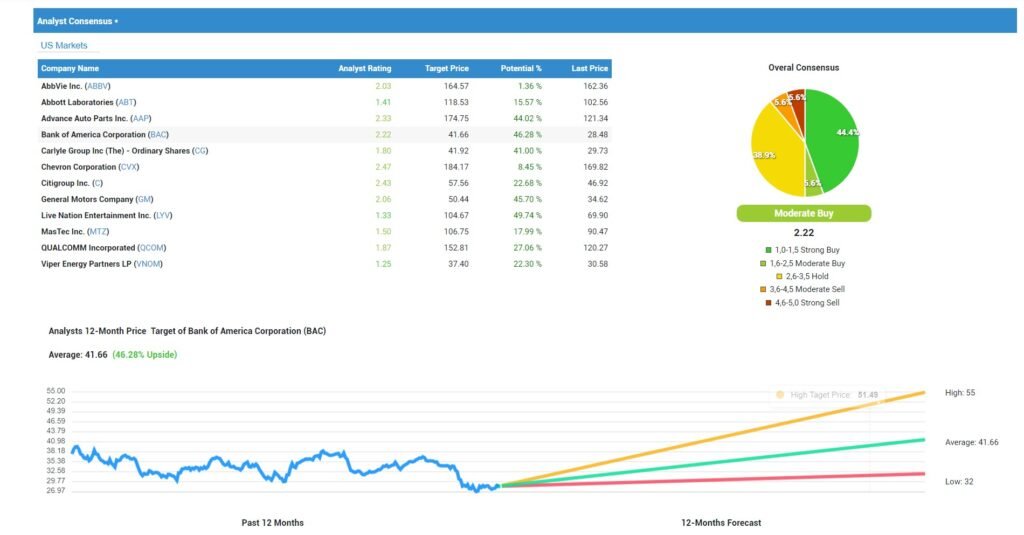
The Consensus Graph measures the suggested investment strategy. Based on the analyst’s recommendations following the stocks, typically, Buy, Hold, Sell. As indicated on the Overall Consensus graph, 44% of the portfolio’s exposure is a Strong Buy and 39% is a Hold. By earnings ratings, GM is a Strong Sell.

The consensus price potential of the Price Targets, follows the analyst’s targets. The stocks rated with the greatest potential upside, at 46% are BAC, $42 and GM, $50. AbbVie (ABBV) has been the best performing stock over the period. ABBV now has an upside potential of +2% and operates in Healthcare.
STOCK: HIGHEST POTENTIAL UPSIDE
Follow, learn and maybe gain some investment ideas trading with EToro. The platform has over 30 million traders and investors. Invest in 3,000+ assets on a trusted and friendly platform.
77% of retail investor accounts lose money when trading CFDs with this provider
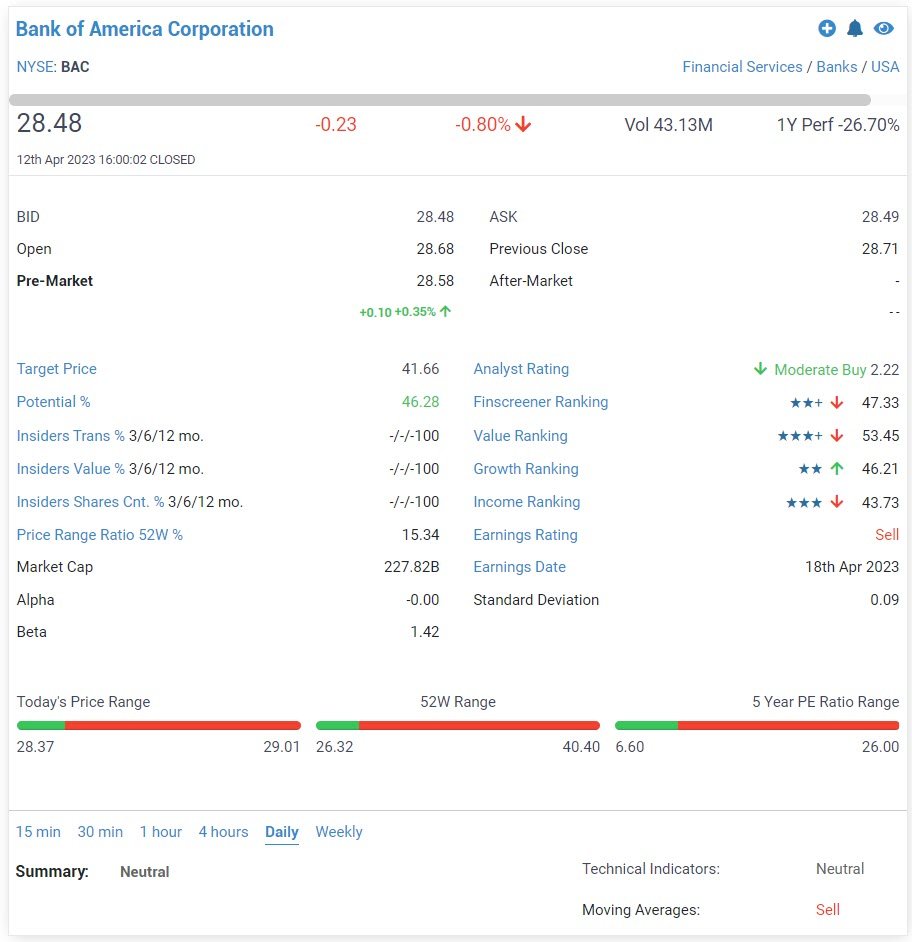
BANK OF AMERICA (BAC)
Bank of America Corp. is one of the top financial holding firms in the U.S. with more than $2.5 trillion in assets. BAC is divided into four business units Consumer banking, global wealth and investment management, worldwide banking, and global markets. Consumer-facing lines of business for Bank of America include its branch network and deposit-taking operations, home mortgage financing, vehicle loans, credit and debit cards, and small-business services. Merrill Lynch’s operations provide brokerage and wealth management services.
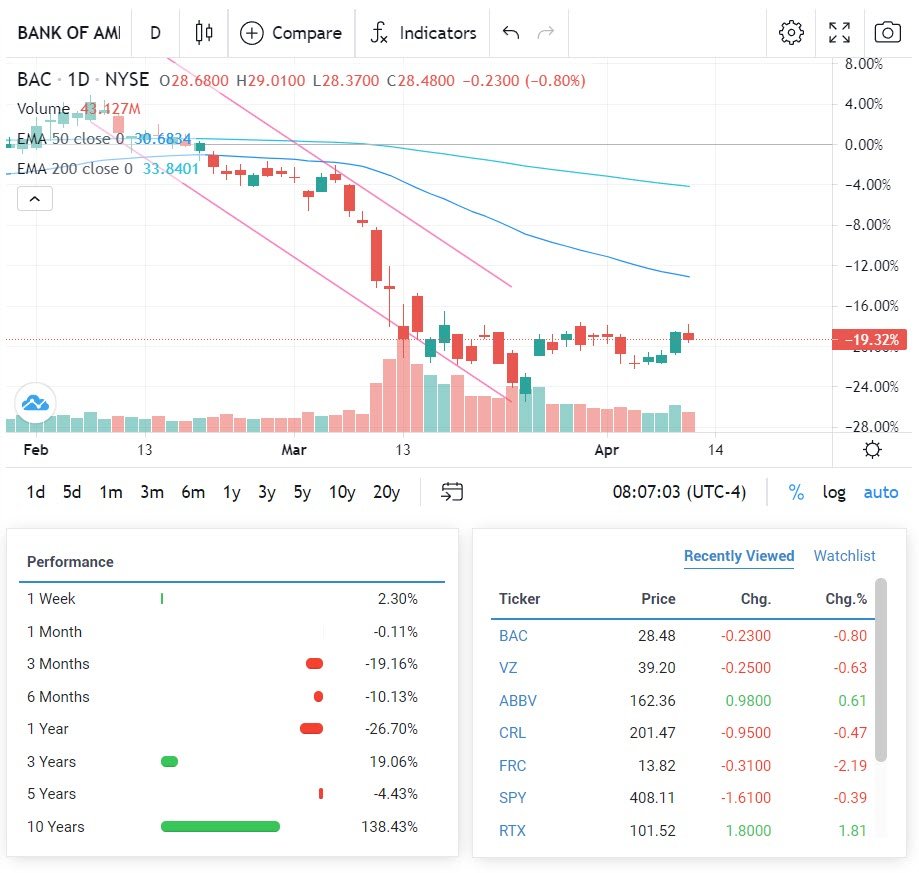
YoY, the Bank of America stock price is down -26.7%, YTD down -14.01%. BAC stock has a five-year performance of -4.43%. Its 52-week range is between $26.32 and $40.4, which gives BAC stock a 52-week price range ratio of 15.34%. BAC is currently trading on a PE ratio of 10.90X, a price-to-book (PB) ratio of 1.15X, a price-to-sale (PS) ratio of 3.39X. The stock’s ROA is 0.91, and a ROE of 11.47%. The company’s profit margin is 25.45%.
How to Invest in Stocks: Dividends and performance

STOCK: BEST PERFORMANCE
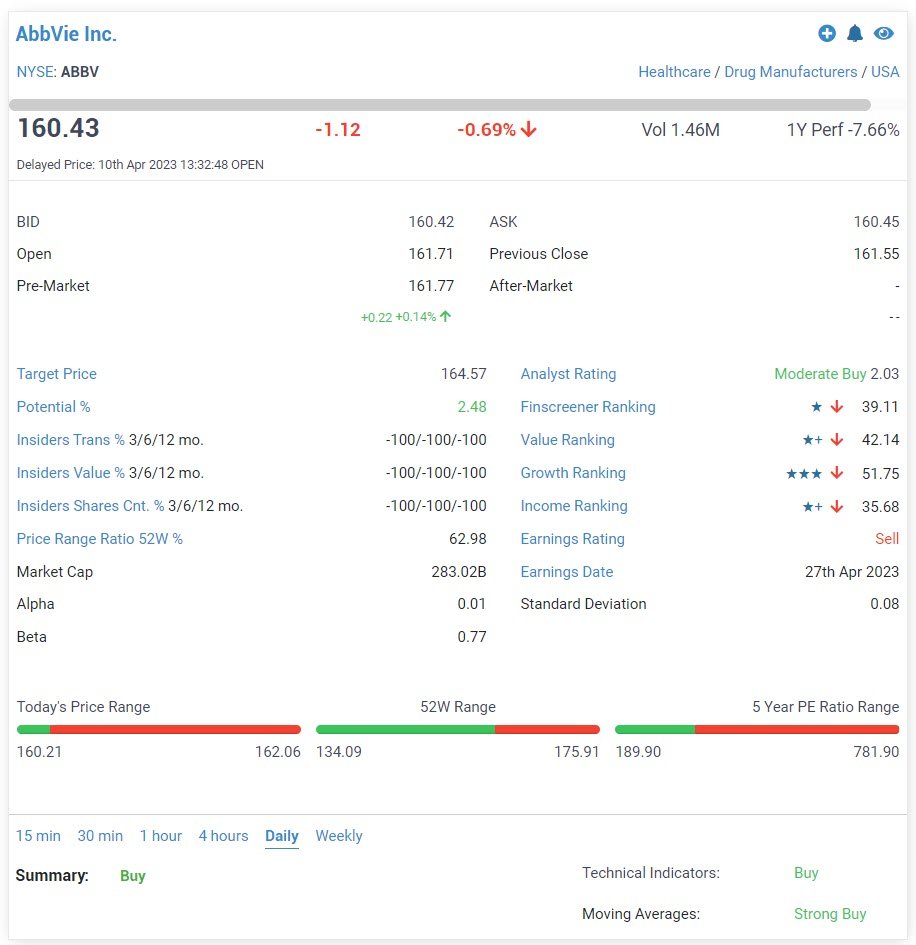
ABBVIE (ABBV)
AbbVie is a multinational pharmaceutical business that focuses on the development of novel medications in fields such as immunology, cancer, neuroscience, and virology. It is headquartered in North Chicago, Illinois. AbbVie has a robust medication pipeline and has gotten many accelerated approvals for products to treat illnesses such as mantle cell lymphoma and marginal zone lymphoma. Furthermore, the business has been working on the development of antibody-drug conjugates to treat a variety of disorders. AbbVie is dedicated to furthering science and improving patient care.
YoY, AbbVie (ABBV) is down 5.03%, YTD down 0.2%. ABBV stock has a five-year performance of 72.23%. Its 52-week range is between $134.09 and $175.04, which gives ABBV stock a 52-week price range ratio of 68.50%
AbbVie Inc. current PE ratio is 355.80X, a price-to-book (PB) ratio of 18.42X, and a price-to-sale (PS) ratio of 6.66X. The ROA is 9.98%, and a ROE of 97.14%. The company’s profit margin is 21.83%, its EBITDA margin is 43.80%. The stock price has limited upside from here.




4 Responses
Play Sugar Rush Slot
kukhareva.com
Excuse, that I interfere, there is an offer to go on other way.
_ _ _ _ _ _ _ _ _ _ _ _ _ _
Nekultsy Ivan iceland github
No