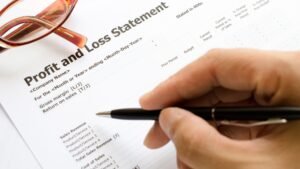
SEVEN QUICK POINTS GRASP THE PROFIT AND LOSS STATEMENT
Understanding the Profit and Loss statement may appear difficult at first, but with some basic understanding and experience, it can become an invaluable tool for examining a company’s financial performance.
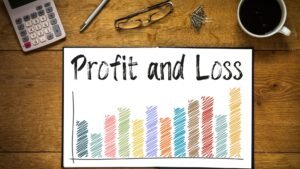
Learn the fundamental components of the profit and loss statement: Revenue or sales, cost of goods sold (COGS), gross profit, operational expenditures, operating income, interest expenses, taxes, and net income are all included in the profit and loss statement. Understanding the P&L statement requires understanding each of these concepts and how they relate to one another.
Here’s a quick list to help you understand the profit and loss statement.
- Revenues
- Gross Operating Profit
- Earnings Before Interest, Taxes, Depreciation and Amortization (EBITDA)
- Earnings Before Interest and Taxes (EBIT)
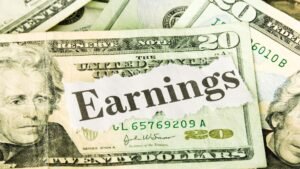
- Earnings (Net)
- Free Cash Flow
- Depreciation Amortisation
PROFIT AND LOSS STATEMENT: REVENUE
Revenue or sales is the top line of the Profit and Loss (P&L) statement, which is also known as the income statement. The P&L statement is a financial statement. It shows a company’s revenues, expenses, and net income or loss for a specific period of time. The period of time could be a month, quarter, or year. The top line of the P&L statement shows the company’s total revenue or sales for that period. This is before any deductions or expenses are taken into account.
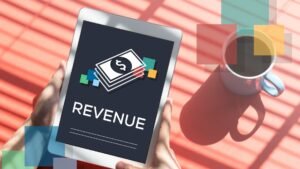
Revenue represents the income that a company generates from its primary business activities. This is the sale of goods or services. It is the starting point for calculating a company’s gross profit (GOP). The GOP is calculated by subtracting the cost of goods sold (COGS) from revenue. Gross profit represents the profit earned from the company’s core operations. This is before taking into account other operating expenses.
REVENUE BROKEN DOWN INTO SEGMENTS

Revenue can be broken down by product or service category, geographic region, or customer segment. This will depend on a company’s reporting and analysis needs. By analyzing revenue trends over time and by category, a company can gain insights into its market performance. This will give an understanding of customer preferences, and product or service mix. Revenue growth is often used as a key performance indicator (KPI). This will measure a company’s financial health and growth potential.

It’s important to note that revenue may not represent the actual cash received by the company. It may include sales that have not yet been collected as accounts receivable.
Additionally, revenue recognition principles and accounting standards can have an impact. The profit and loss impact will be the timing and amount of revenue recognized in the P&L statement. This can affect the accuracy of revenue or sales figures.
Analysing trends in revenue can provide insight into a company’s growth potential. Solid sales growth should be key in instigating market performance. Keep in mind there are three ways cash enters a company; sales, financing, and selling assets.
To help you to prepare to sell a Family Business, click HERE.
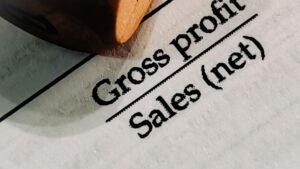
GROSS OPERATING PROFIT
Gross Operating Profit (GOP) is a financial metric that represents the profit earned by a company. This is from the company’s core operations before deducting operating expenses. It is calculated by subtracting the cost of goods sold (COGS) from the company’s revenue or sales. This is the gross profit earned by the company from its primary business activities.
The GOP provides insight into the profitability of a company’s core operations. In the GOP calculation other expenses such as salaries, rent, and marketing expenses are not taken into account. Used to evaluate a company’s ability to generate profits. This will be the profits from its primary business activities. Also used to compare the profitability of different product lines or business units.
Thus, understanding the trends in operating expenses assists in identifying imbalances or inefficiencies. They could be in areas where the company is overspending or where it can cut costs.
GROSS MARGIN
The GOP can be expressed as a percentage of revenue or sales, known as gross margin. Gross margin is calculated by dividing GOP by revenue or sales and multiplying by 100. Gross margin is often used as a KPI to measure. This will be for a company’s profitability and efficiency in managing its cost of goods sold.
The GOP does not take into account other expenses that are necessary for running a business. Such as salaries, rent, and marketing expenses. Therefore, it should be used in conjunction with other financial metrics. Other metrics such as net income, operating income, and EBITDA. This will give a complete picture of a company’s financial health and profitability.
PROFIT AND LOSS STATEMENT: EBITDA
EBITDA stands for Earnings Before Interest, Taxes, Depreciation and Amortisation. EBITDA is calculated from a Company’s Profit & Loss. Focused on the Cash Earnings before Interest Expense and Taxes.

EBITDA measures a Company’s Operating Cash Flow before deducting the non-cash items. These include Depreciation and Amortisation. EBITDA is calculated by the formula.
EBITDA = Sales – Op Expenses + Depreciation + Amortisation
Non- Cash items of Depreciation and Amortisation are added back. Thus, the EBITDA figure is focused on Operating Cash Flow. Like the EBIT figure, lower in the Profit and Loss. The EBITDA figure excludes the impact of leverage, interest rates and taxes. The EBITDA figure is a useful guide for intra-sectoral valuations. The Ratios could be,
EBITDA / Sales, a margin expressed as a percent.
or EV / EBITDA, a multiple.
PROFIT AND LOSS STATEMENT: EBIT
EBIT measures a company’s operating performance and is calculated by the formula:
EBIT = Total Sales – COGS – Operating Expenses
Thus, the EBIT result depends on the Sales result. This is product pricing x volume and the cost efficiency. EBIT looks at a company’s operating performance. Without the impact of the Capital Structure or Leverage, Interest Expense and Taxes.

A Company’s Market Capitalisation plus Net Debt known as Enterprise Value (EV), can be divided by EBIT. The Multiple can give an estimate of a company’s intra-sectoral efficiency. Or how much EBIT is produced by EV. The formula is.
EBIT Multiple = EV / EBIT
A comparatively high ratio will indicate that the EBIT generated is low based on the capital employed.
NET EARNINGS
Dividends
PROFIT AND LOSS STATEMENT: FREE CASH FLOW
Free Cash Flow (FCF) is an important number to consider. FCF determines the Cash Flow available to pay the Company’s financial stakeholders. FCF is the total cash flow generated by a company from normal Operations. The calculation takes Retained Earnings, adjusting for non-cash expenses in the Profit and Loss.

They are Depreciation and Amortisation and the Balance Sheet items of changes in Working Capital and CAPEX. Free Cash Flow is the cash a company has available to pay or fund obligations. Obligations can be real or expected, of the two financial stakeholders in a Company. They are, Debtors in repaying and servicing Debt obligations. Then to pay Dividends to Shareholders an expected obligation.
Depreciation Amortisation
Depreciation is an accounting charge used to decrease the value or depreciate the value of a productive asset. For example, a computer purchased FY0 will have its value depreciated over a period of time to zero in FY-X. In accounting terms, this indicates an end to its value to the company, or obsolescence. Depreciation is a non-cash charge, and an adjustment is made in the Cash Flow Statement. This reflects the non-movement in Cash Flow over the FY.
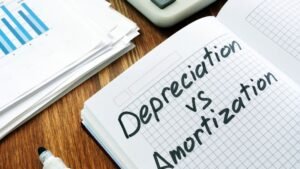
Amortisation is a non-cash expense taken against the Profit and Loss. This is for the reduction in the Balance Sheet Valuation of intangible assets. Amortisation is an expense used in the preparation of the annual financial statements. It is a non-cash item as there is no cash payment.
ADJUSTMENT TO CASH FLOW
As amortisation is recognised as an expense, it reduces the taxable income of a company. It does not impact the company’s cash position. An adjustment is made in preparing the Cash Flow Statement. The purpose is to recognise the decreasing value of an intangible asset. It has the effect of reducing the value of the intangible asset on the balance sheet.
An amortisation schedule will conform to GAAP or IFRS Accounting Standards. An intangible asset is an asset that cannot be touched. For example, Goodwill, Intellectual Property, Patents, Copyrights and Trademarks. When applied to an asset, amortisation is similar to the depreciation of a fixed asset.