The World’s Top 10 Stock Markets

Investing in the World’s 10 Largest Stock Exchanges has become so easy, mainly via ETFs. In 2023, the total Stock Market capitalisation of the world’s stock markets could exceed $100 trillion.
Let’s take a look!
In terms of market capitalization, the NYSE is the world’s largest stock exchange. It was founded in 1792 and is located on New York City’s Wall Street. There are more than 2400 companies listed on the NYSE, which has a market capitalization of $26.2 trillion. There are a lot of well-known companies on the list, and they come from a broad range of industries.
Some of the major corporations listed include Bank of America, Caterpillar, and Procter & Gamble. The average monthly volume is around 5% of Market Cap. The most common indices on the NYSE are the DJIA (an index of 30 well-known stocks), the S&P 500 (which follows the 500 biggest companies in the US),
The Standard and Poor’s 500, or simply the S&P 500, is a stock market index tracking the stock performance of 500 large companies listed on stock exchanges in the United States. It is one of the most followed equity indices. As of December 31, 2022, more than $5.4 trillion was invested in assets tied to the performance of the index. The S&P 500 index is a free-float capitalization-weighted index.

As of August 31, 2022 the nine largest companies listed of the S&P 500 accounted for 27.8% of the market capitalization. In order of highest to lowest weighting: Apple, Microsoft, Alphabet, Amazon, Tesla, Berkshire Hathaway, UnitedHealth Group, Johnson & Johnson, and ExxonMobil. The stocks that have increased their dividends consistently over the past 25 consecutive years are the S&P 500 Dividend Aristocrats.
The S&P500 is one of the input used in calculating the Conference Board Leading Economic Index. This Index is used to forecast the direction of the economy. The index is associated with many ticker symbols, including ^GSPC, .INX, and $SPX, depending on market or website.
The SPDR SP 500 ETF Trust seeks to provide investment results that, before expenses, correspond generally to the price and yield performance of the SP 500 Index.
The NASDAQ is an American stock exchange that focuses on technology and growth-oriented businesses. The total market cap is over $13 trillion making the NASDAQ, the second largest stock exchange in the world. The exchange is located in New York, just around the corner from the NYSE. It was the first electronically traded stock exchange in the world, established in 1971. There are more than 3000 companies listed on NASDAQ, and the average monthly volume is around 6.5%.
The U.S. Mega Technology companies listed on the NASDAQ combined, make up around 9% of Global market capitalisation. The list of companies include Microsoft, Google, Facebook, Amazon, Tesla, Apple. There are many more large companies listed on the NASDAQ. Apart from Tech, other sectors represented on the NASDAQ includes health care, banks and consumer services sectors.
The key indexes:
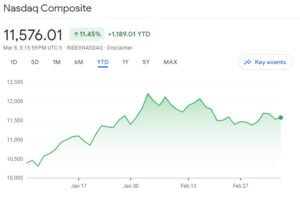
NASDAQ Composite Index
the NASDAQ 100
the NASDAQ Non-Financial Index
The Nasdaq Composite is a stock market index that includes almost all stocks listed on the Nasdaq stock exchange. Along with the Dow Jones and S&P 500, it is one of the three major stock indices in the US. The composition of the NASDAQ Composite is heavily weighted towards companies in the Information Technology sector.
The Nasdaq-100, which includes 100 of the largest non-financial companies in the Nasdaq Composite, accounts for over 90% of the movement of the Nasdaq Composite. The Nasdaq Composite is a capitalization-weighted index. The index price is calculated by taking the sum of the products of closing price and index share of all of the securities in the index. The sum is then divided by a divisor which reduces the order of magnitude of the result.
NASDAQ ETFs
There is the well-known Invesco QQQ Trust, the QQQ replicates the Nasdaq-100 Index. The Fund will, under most circumstances, consist of all of stocks in the Index. The Index includes 100 of the largest domestic and international nonfinancial companies listed on the Nasdaq Stock Market based on market capitalization. The Fund and the Index are rebalanced quarterly and reconstituted annually.
The First Trust NASDAQ-100-Technology Sector Index Fund is an exchange-traded index fund. The investment objective of the Fund is to replicate as closely as possible, before fees and expenses, the price and yield of the NASDAQ-100 Technology Sector Index.
The Shanghai Stock Market (SSE) is China’s main stock exchange, located in Shanghai. The SSE started out in the year 1866 and has risen dramatically in recent years to become Asia’s largest exchange in Asia. Of course, this is due to the growth in China’s economy, now one of the world’s largest. The SSE is made up of more than 1,500 publicly traded companies with a total market value of $6.87 trillion. PetroChina, Industrial and Commercial Bank of China, and Agriculture Bank of China are three of the biggest stocks on this exchange. Other China’s major corporations, including Alibaba and China Mobile.
Class ‘A’ shares on the SSE are priced in local yuan, while Class ‘B’ shares are priced in US dollars. Class ‘A’ shares can only be bought by Chinese unless they are eligible for the foreign investment scheme. On the other hand, investors from both inside and outside the country can buy Class “B” shares.
The key indexes:
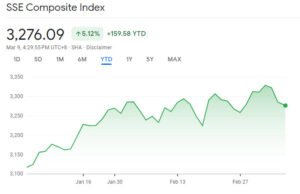
the SSE Composite Index
the SSE 50 Index
the SSE 180 Index
The SSE Composite Index also known as SSE Index is a stock market index of all stocks that are traded at the Shanghai Stock Exchange. There are also SSE 180, SSE 50 and SSE Mega-Cap Indexes for top 170, 50 and 20 companies respectively, and the CSI 300 Index, which includes shares traded at the Shanghai Stock Exchange and the Shenzhen Stock Exchange.
SSE ETFs
The iShares China Large-Cap ETF seeks to track the investment results of an index composed of large-capitalization Chinese equities that trade on the Hong Kong Stock Exchange. The ETF seeks investment results that correspond generally to the price and yield performance of the FTSE China 50 Index.

Founded in 2000, Euronext is a stock exchange for many different countries, known as the European Stock Exchange. Euronext is based in Amsterdam and has operations across Europe. This includes operations in London, Paris, Lisbon, Brussels, Dublin, Milan, and Oslo. There are more than 1300 companies listed on Euronext, and the market capitalization of all of these companies is $6.65 trillion, just over 6% of Global Market Cap. Many of Europe’s top corporations, including Total, L’Oreal, and Unilever, are listed on Euronext.
The key indexes:
EUROSTOXX 100
EUROSTOXX 600
The Euronext 100 is considered to be the blue-chip index, comprised of the 100 largest and most liquid stocks. Also, about 65% of this index is made up of French companies. And the other indices are AEX-INDEX (companies in the Netherlands), BEL 20, FTSE MIB (companies in Italy), and OBX 25. (Norway). Procter & Gamble, LVMH, Royal Dutch Shell, Merck & Co., and L’Oreal are some of the biggest stocks on this exchange.
The STOXX Europe 600, also called STOXX 600, SXXP, is a stock index of European stocks designed by STOXX Ltd. This index has a fixed number of 600 components representing large, mid and small capitalization companies among 17 European countries, covering approximately 90% of the free-float market capitalization of the European stock market.
The countries that make up the index are the United Kingdom, France, Switzerland and Germany. As well as Austria, Belgium, Denmark, Finland, Ireland, Italy, Luxembourg. Also, the Netherlands, Norway, Poland, Portugal, Spain, and Sweden.

The STOXX Europe 600 was introduced in 1998. Its composition is reviewed four times a year, in March, June, September, December. The index is available in several currency and return variant combinations. It is licensed to financial institutions to serve as underlying for a wide range of investment products such as exchange-traded funds, futures, options, and structured products worldwide.
EURO ETFs
The iShares Core MSCI Europe ETF seeks to track the investment results of an index composed of large-, mid- and small-capitalization European equities. The ETF seeks to track the investment results of the MSCI Europe Investable Market Index.
The TSE is Japan’s principal stock market and was established in 1878. More than 3500 companies are listed on the TSE, and their combined market capitalization exceeds $5.67 trillion. The TSE also has two sections, the first is for large companies, and the second is for medium-sized companies. The TSE is known for the high level of market surveillance and compliance. Most of Japan’s major corporations and conglomerates are listed on the TSE. The list includes the car manufactures Toyota and Honda and consumer electronics Sony.
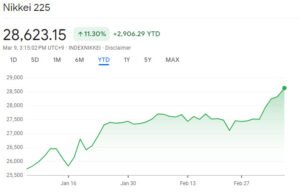
The two most important indices on TSE are the Tokyo Price Index (TOPIX) and the Nikkei 225. The TOPIX uses a free-float capitalization-weighted metric to rank companies The Nikkei 225 ranks the top 225 large, publicly owned companies in Japan from a wide array of industry sectors. The Nikkei 225 is a price-weighted index, quoted in the Japanese Yen. The components are reviewed on an annual basis.
JAPANESE ETFs
The iShares MSCI Japan ETF seeks to track the investment results of an index composed of Japanese equities. The ETF seeks investment results that correspond generally to the price and yield performance of the MSCI Japan Index.
The HKEX is Hong Kong’s principal stock market and one of the largest in Asia. It was established by the British in in 1891. The main index is the Hang Seng Index, is a free-float, adjusted-Market Cap-weighted index with 50 stocks. This Hang Seng Index accounts for around 58% of the total Market Cap of the HKEX.

There are more than 2200 companies listed, half of which are located in mainland China. A large portion of the $43.5 trillion market capitalization of the HKEX is made up of the top 20 companies. Some of the biggest companies in the world, like PetroChina, China Mobile, HSBC Holdings, AIA, Bank of China, are listed on the exchange.
HONG KONG ETFs
The iShares MSCI Hong Kong ETF seeks to track the investment results of an index composed of Hong Kong equities. The ETF seeks investment results that correspond generally to the price and yield performance of the MSCI Hong Kong Index.
![]()
Barchart is a financial data and technology provider that offers a variety of tools and resources for investors. For this article information about exchange-traded funds (ETFs) was researched using Barchart. A wide range of ETFs can be screened on Barchart by performance data, charts, news, and analysis. These are only some of the data that can searched for using Barchart. The user interface allows for a search for a specific ETF, or a perusal of the available options based on asset class, investing strategy, industry, and other criteria.
Barchart also features analysis and comparison tools for exchange-traded funds (ETFs). Users can compare the performance of several ETFs side by side, and screeners allow users to filter ETFs based on parameters like expense ratio, yield, and asset class. Investors may learn more about ETFs and other investment vehicles, as well as keep up with market news and analysis, through Barchart’s news and analysis and instructional materials.
In summary, Barchart can be a helpful tool for anyone who want to learn more about ETFs, conduct in-depth analysis, and then make educated investment decisions.
I am a member of the Barchart Affiliate Program, please use the attached link if you would like the Subscribe.
Located in Shenzhen, also referred to as the Silicon Valley of China, is the Shenzhen Stock Exchange. The SZSE, which was founded in 1990, is China’s second-largest stock exchange after the Shanghai Stock Exchange. There are more than 1,900 companies on the SZSE, and the market cap is $5.24 trillion.
Most businesses are based in China and use the Yuan as their primary currency. It also has a place where two kinds of shares can be traded: A shares, which are traded in the local currency, and B shares, which are traded in US dollars for investors from other countries. Tencent, Huawei, and Ping An are among the many technology and growth-oriented enterprises listed on the SZSE.
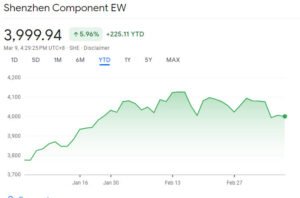
The two most popular indices on this market are the SZSE Component Index, which includes 500 stocks. It is the main stock market index of SZSE. Then the SZSE 100, comprised of the top 100 companies on the SZSE. Even though SZSE is a self-regulatory organization, the China Securities Regulatory Commission (CSRC) has the power to step in during volatile times.
CHINESE TECH ETFs
The Invesco China Technology ETF seeks investment results that correspond generally to the performance, before the funds fees and expenses, of the Alpha Shares China Technology Index. CQQQ generally will invest in all of the securities comprising the index in proportion to their weightings in the index.
The London Stock Exchange (LSE) is one of the oldest stock exchanges in the world, founded in 1801. It is owned by and run by the London Stock Exchange Group. It was the first to set price, market, and liquidity benchmarks for the equity markets in Europe. About 3000 companies with a total market value of $4.13 trillion coming from over 100 countries. This makes the LSE one of the world’s most varied stock exchanges. Some well-known British companies that trade on the LSE are Barclays, British Petroleum, and GlaxoSmithKline.
The most important index on the LSE is the Financial Times and London Stock Exchange (FTSE) 100 index. There are also the FTSE 250, FTSE 350, and FTSE All-Share indices on the exchange. The LSE also has two markets, one of which is the main market, which has more than 300 large companies from all over the world. Another one is the Alternative Investment Market, which is a global market for small-cap companies.
 The Financial Times Stock Exchange 100 Index, also called the FTSE 100 Index, FTSE 100, FTSE, or, informally, the “Footsie”, is a share index of the 100 companies listed on the London Stock Exchange with the highest market capitalisation. The index is maintained by the FTSE Group, a subsidiary of the London Stock Exchange Group
LSE ETFs
The iShares MSCI United Kingdom ETF seeks to track the investment results of an index composed of U.K. equities. The ETF seeks investment results that correspond generally to the price and yield performance of the MSCI United Kingdom Index.
The Toronto Stock Exchange (TSX) is Canada’s principal stock exchange, and it is headquartered in Toronto. It is a wholly owned subsidiary of TMX Group’s financial services division, founded in 1852. There are more than 2200 companies listed on the TSX, and the market capitalization is $3.1 trillion. Several of Canada’s major corporations, RBC, the Canadian National Railway and Shopify are listed. The Canadian economy is a natural resource economy and listed on the TSX are mining and oil and gas companies.
The main index of the TSX, the Standard & Poor (S&P)/TSX 60, is mostly made up of energy companies. The TSX Composite Index, which shows about 70% of the market capitalization of the Toronto Stock Exchange, can also be used to track the top 100 companies. Some of the well-known businesses are the Royal Bank of Canada, Suncor Energy, Fortis, and others.
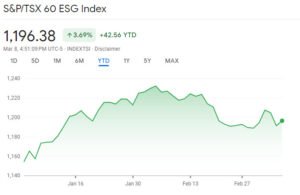
The S&P/TSX 60 Index is a stock market index of 60 large companies listed on the Toronto Stock Exchange. The Index is designed to represent leading companies in leading Canadian industries. The S&P/TSX 60 Index also represents the Canadian component of Standard & Poor’s flagship S&P Global 1200. The S&P/TSX 60 Index was launched on December 30, 1998
.

The British started the Bombay Stock Exchange in 1875. It is one of the oldest stock exchanges in Asia. It is one of the top 10 stock markets in the world. BSE is the name of India’s biggest stock exchange, and it is located on Bombay’s Dalal Street. Many of India’s top corporations, including Tata Motors, Reliance Industries, and HDFC Bank are listed on the exchange. Most of the more than 5500 businesses that are listed on the BSE are small ones. Also, it has helped businesses grow their corporate sectors and financial markets. The BSE has a market cap of $3.5 trillion as a whole.
The main index on this exchange is the S&P BSE SENSEX, which is the most watched index in India. Sensitive index, which is also called Sensex, is made up of 30 stocks that represent different parts of the economy.
The BSE SENSEX is a free-float market-weighted stock market index of 30 well-established and financially sound companies listed on the Bombay Stock Exchange.
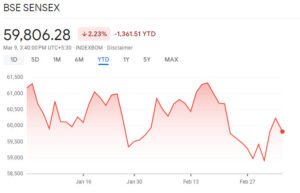
The 30 constituent companies which are some of the largest and most actively traded stocks, are representative of various industrial sectors of the Indian economy. Published since 1 January 1986, the S&P BSE SENSEX is regarded as the pulse of the domestic stock markets in India. The base value of the SENSEX was taken as 100 on 1 April 1979 and its base year as 1978–79. On 25 July 2001 BSE launched DOLLEX-30, a dollar-linked version of the SENSEX.
The NIFTY 50 is a benchmark Indian stock market index that represents the weighted average of 50 of the largest Indian companies listed on the National Stock Exchange. It is one of the two main stock indices used in India, the other being the BSE SENSEX. The NIFTY 50 index has shaped up to be the largest single financial product in India, with an ecosystem consisting of exchange-traded funds, exchange-traded options at NSE, and futures and options abroad at the SGX. The NIFTY 50 index covers 13 sectors of the Indian economy and offers investment managers exposure to the Indian market in one portfolio.
INDIAN EFTs
The iShares MSCI India ETF seeks to track the investment results of an index composed of Indian equities. The ETF seeks investment results that correspond generally to the price and yield performance, before fees and expenses, of the MSCI India Total Return Index.