THE BULL MARKET EQUALS MEGA CAP TECH
Both stocks and bonds will likely benefit if the June CPI in the U.S. continues to slow. The June CPI figure could even touch a 27-month low of +3.1% year on year. The CPI for May was +4.0%. Looking at the June CPI ex-food and energy expectations are 5.0%, down from 5.3% in May.
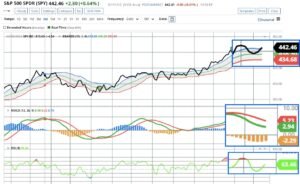
Stock indexes closed moderately higher on Tuesday. The S&P 500 Index, SPY ETF closed up +0.67%, and the Nasdaq 100 Index QQQ ETF closed up +0.49%. Events outside U.S stocks also benefitted the market. Chinese authorities have increased relief measures for property developers.
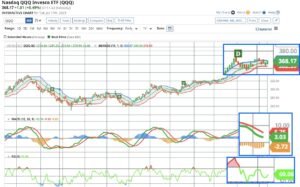
Also a Fed President stated that he does not see a recession. There is the continued expectation of around 90% rise in interest rates by 25 bps at the upcoming F.O.M.C meeting. Markets expect a peak Fed Funds rate of 5.4% by year end, the current effective Fed Funds rate is 5.07%.
Subscribe to
a rebound or recovery or growth story
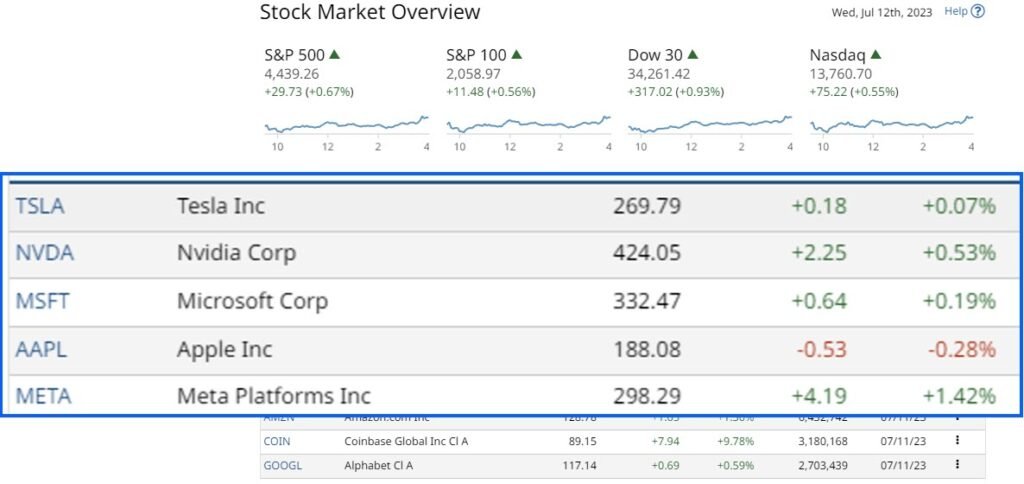
So far in 2023, the Nasdaq 100 (NDX), has gained roughly 40% YTD, compared to the S&P 500’s plus 15%. The Magnificent Seven and their stellar performance in 2023, has driven the bull market. The performance from the large cap tech stocks have been stellar.
Think of this, Nvidia (NVDA) +195%, Tesla (TSLA) +149%, Meta (META) +136%, Apple (AAPL) +51%, Amazon (AMZN) +48%, Microsoft (MSFT) +39% Alphabet (GOOGL) +31%.
It has been quite a rebound or recovery or growth story, depending on your market perspective. To put things in perspective, if not for these enormous gains, the S&P 500 would be slightly down on the year. The Nasdaq 100 is certainly overconcentrated with these stocks. What is next for the markets? There are signs of a broader market, and previously forgotten gathering pace.

The earnings season what’s next for the bull market
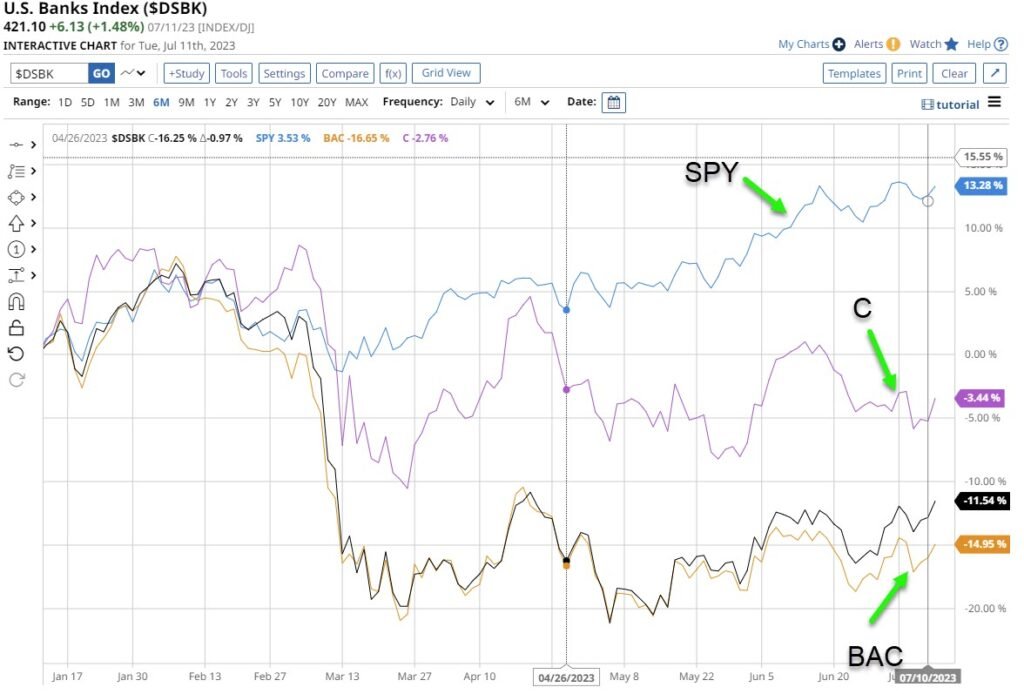
The earnings season starts Friday, and the banks will lead off. Reporting first will be the major U.S. banks, and it could be a bit of a “show me the money” situation. The first half of 2023 has been difficult highlighted with the collapse of a number of banks. The two notable ones were First Republic and Silicon Valley Bank.
The major banks which will be reporting are JPMorgan (JPM), Wells Fargo (WFC), and Citigroup (C). Keenly watched will be the data on loan and deposit growth. At the likely expense of the Regional Banks loans and deposits are expected to have a sound level of growth. Of the major banks, the two considered to be undervalued banks are Bank of America (BAC) and Citigroup (C).
Consol Energy Inc (CEIX)
The chart depicts the New Buy signal on July 11, 2023 at an entry price of $67.89. This is based on the crossover of the 50-200 Day MACD Oscillator. When the shorter term moving average closes above the longer-term moving average, it suggests the beginning of an upward trend.
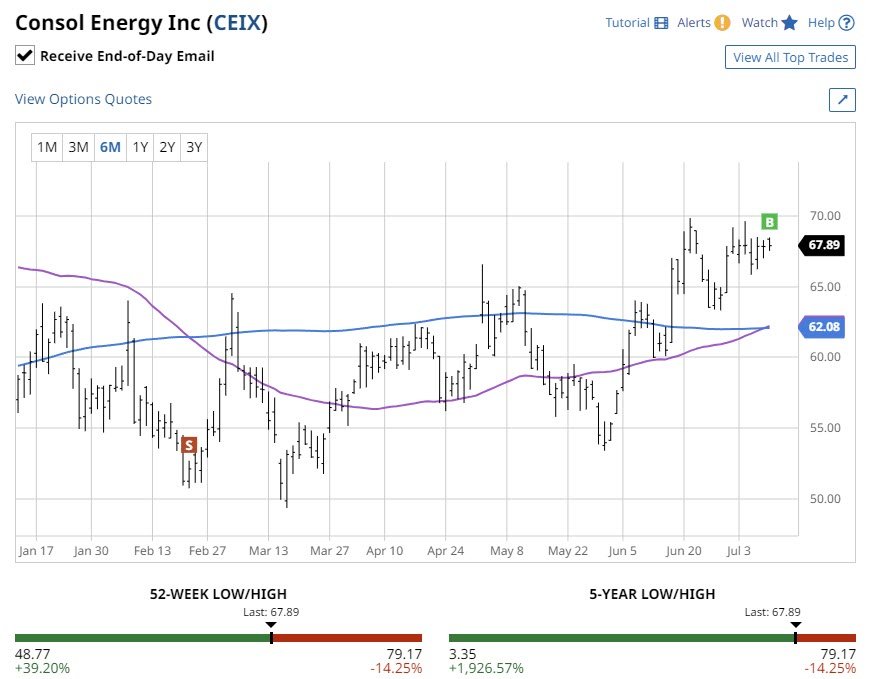
50-200 Day MACD Oscillator
Over the past 5-Years, a Buy signal on 50-200 Day MACD Oscillator for CEIX has resulted in a gain of +648.72%. This compared to a 5-Year market gain on the stock of +77.03%. The Signal gain is based on only 2 trades, so not a lot of data. The average duration was 431 days per trade.
Global bond yields are volatile. The 10-year Treasury note yield is currently at 3.986% and 10-year German bund yield is 2.649%. The 10-year UK Gilt yield increased by 2.3 basis points to 4.66%.
Overseas stock markets Tuesday settled higher. The Euro Stoxx 50 closed up +0.71%., the Shanghai Composite Index closed up +0.55%. While Japan’s Nikkei Stock Index was flat.
Investment ideas from 30 million users. Invest in 3,000+ assets on a trusted and friendly platform.
77% of retail investor accounts lose money when trading CFDs with this provider
Subscribe to
Traders from all around the world use online trading to benefit from the world’s largest and most liquid markets, trading up to $6 Trillion per day.
Due to innovations in technology investors and traders can now invest in a range of securities. Forex, Commodities, Energies, Indices & Stocks, easily to trade with FX PRIMUS at the click of a button.
BARCHART: QUICK STOCK IDEAS
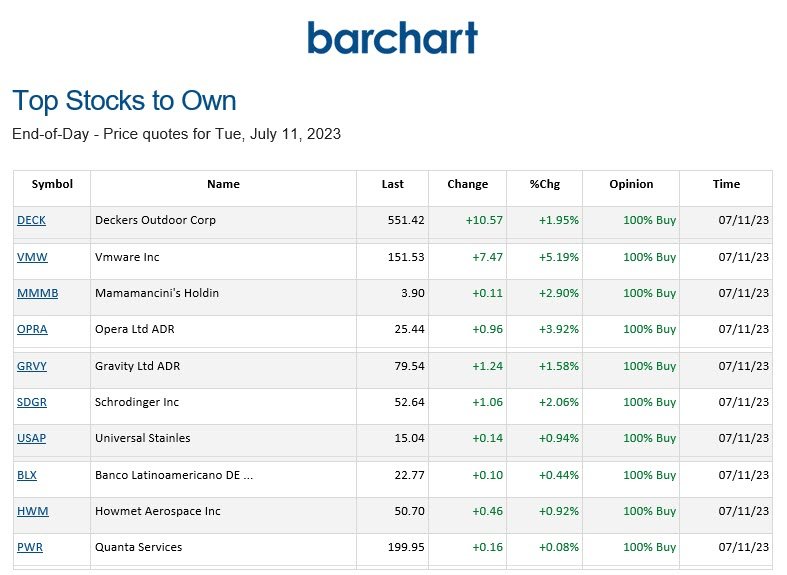
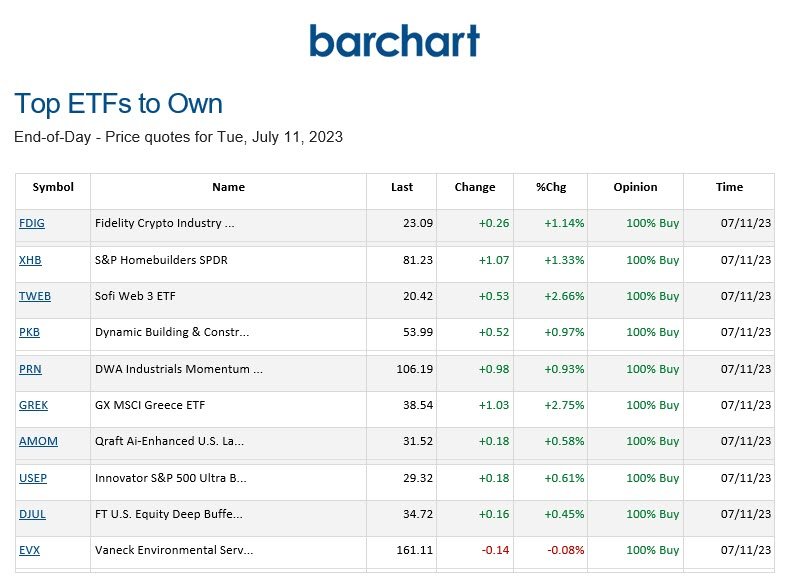
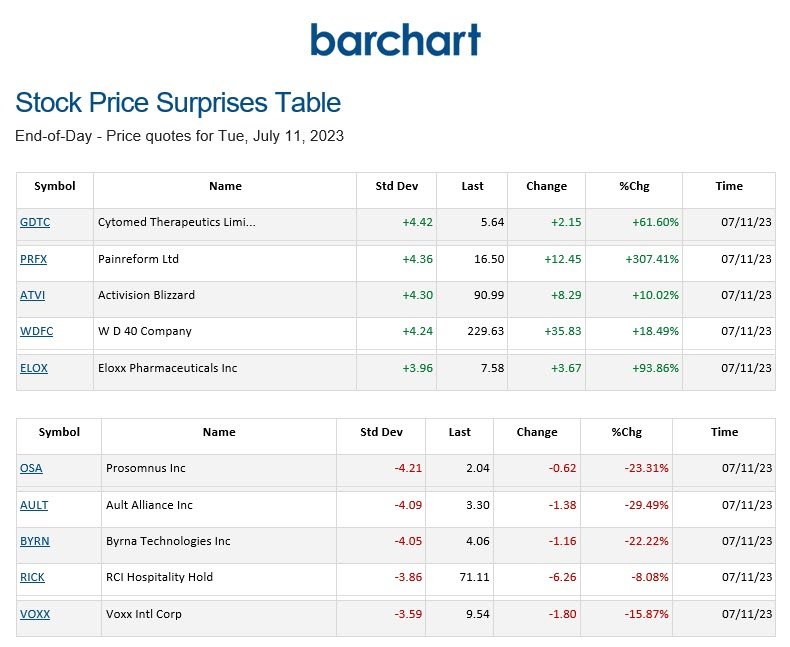
PRICE SURPRISES AND VOLATILITY
![]() surprises both upside and downside.
surprises both upside and downside.
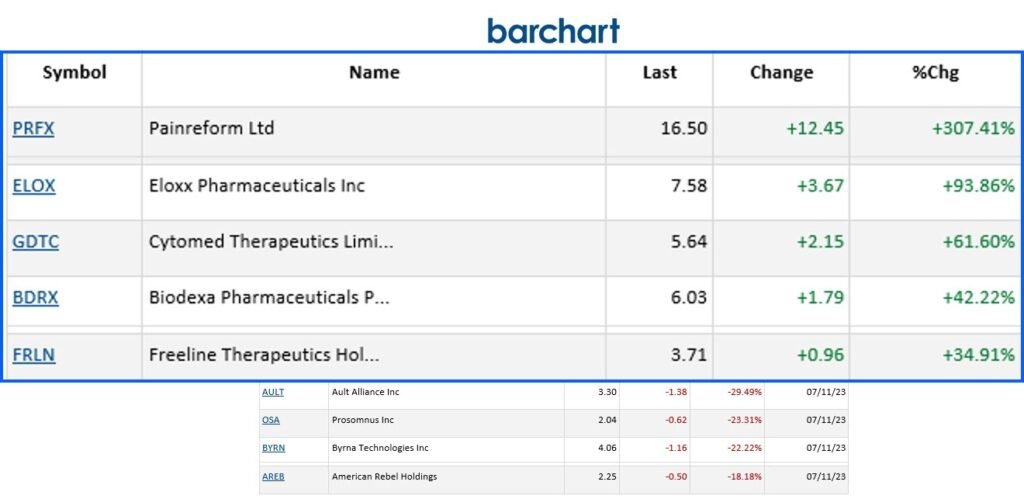
STOCK PERFORMANCE LEADERS AND LAGGARS
Stocks below are ranked by Barchart based on the Highest Daily Percentage Change.
![]()
The charts used in this Blog Post are from Barchart. Barchart is a financial data and technology company that provides financial market data, news, analysis, and trading solutions.


