smartest-data blog

U.S. stocks indexes are approaching correction territory

MAJOR INDEXES NEAR CORRECTION LEVELS

This week, stock investors have concerns as the indexes near correction levels. They will have one eye set on the Federal Reserve and the other set on earnings. The FOMC will meet on Wednesday, and the rate announcement will be made on Thursday. It is widely expected that the Fed Funds Rate will remain unchanged. Thus, the target federal funds rate will remain between 5.25% and 5.5%.

correction territory

Thus, the key message or conclusion drawn from the FOMC meeting will be if a rate hike at the December 13 meeting will be more or less likely. Current market predictions sit at 22%. Also, if or when rate cuts could start in 2024, what will be the catalyst? The major catalysts to consider are all related. They are falling inflation, a weakening economy, and rising unemployment.

correction territory

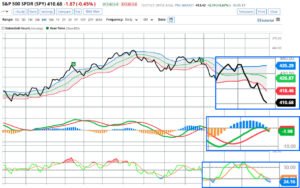
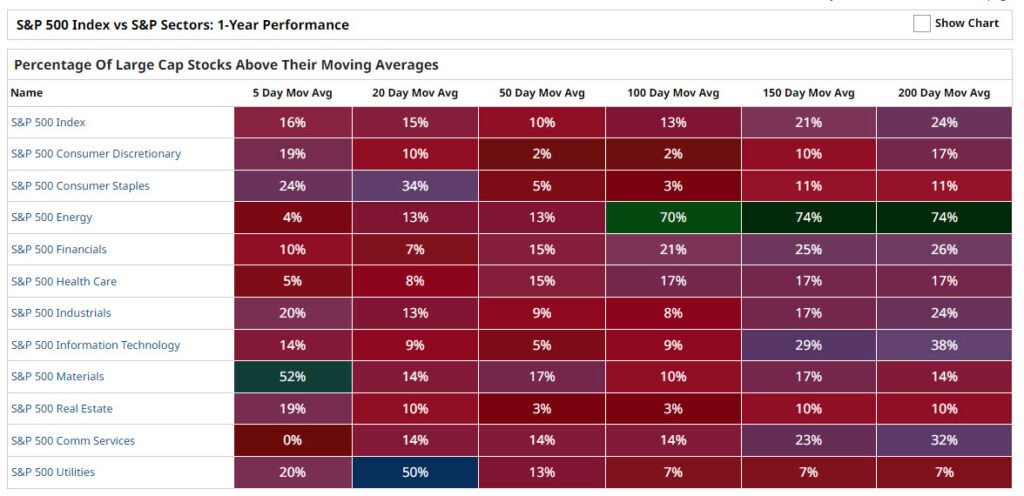
Last week, the major U.S. stock indexes fell, which was largely due to the mega-cap technology corporations. Google lead the way. The S&P 500 (SPY) fell 2.53% last week, closing around 4,117. The story was that it was down for four out of the five sessions. Friday’s closing price was more than 10% below the S&P’s 52-week high of 4,588.96 points reached on July 31. Thus, the benchmark U.S. indexes are entering correction territory.

All of my Blog Posts contain Affiliate Links to products or services that are known to me. I may receive art any time a commission if a purchase or subscription is made via an Affiliate link.

Subscribe to

S&P sectors finished down 

Eleven S&P sectors finished down on the week. In fact, the Utilities Sector (XLU) a classic defensive sector, this was the only positive. The recent top performer, Energy (XLE) was down over 6% on the week. Communication Services (XLC) lost more than 5%. The top performer for 2023 technology (XLK) fell almost 2%.

higher yields impacting stocks 

To highlight mid-last week, the Nasdaq Composite touched the correction zone. Certainly, a key drag on the S&P 500 index and the Nasdaq 100 are the increasing bond yields. In particular, at the long end of the U.S. Yield curve, this trend is set to continue. The 10-year yields increased to over 5%, currently 5.03%. The yields on the 10-years were sitting at 4.06% just three months ago and 3.76% only six months ago.

Correction territory and short-term rates

There is a debate about whether current economic data does not warrant retaining short-term rates at current levels. Cuts in the Fed Funds rate are starting to be predicted. This is one of the debates the FOMC will be having at its meeting this week. There are increasing concerns that the U.S. economy may respond negatively if the Fed overtightens. Disinflation is a faintly emerging but very real risk. The 125-basis point increase in 10-year yields over the past six months is a warning sign.

Key Inflation Data

The U.S. PCE deflator data, the Fed’s favored inflation indicator, was in line with market forecasts. Thus, the potential impact of Fed policy predictions was little influenced. The September PCE deflator data was higher than expected, at +0.4% month-on-month. The year-on-year number of +3.4% was in line with market forecasts.

The September Core PCE deflator result of +3.7% year-on-year was in line with market predictions. The September personal income report was somewhat below estimates at +0.4%. But the September personal expenditure report was above the predicted +0.5%.

Investment ideas from 30 million users. Invest in 3,000+ assets on a trusted and friendly platform.

77% of retail investor accounts lose money when trading CFDs with this provider

Subscribe to

Traders from all around the world use online trading to benefit from the world’s largest and most liquid markets, trading up to $6 Trillion per day.
Due to innovations in technology investors and traders can now invest in a range of securities. Forex, Commodities, Energies, Indices & Stocks, easily to trade with FX PRIMUS at the click of a button.

BARCHART: QUICK STOCK IDEAS

 Stocks and ETFs to Own.  
 

PRICE SURPRISES AND VOLATILITY

surprises both upside and downside. 

STOCK PERFORMANCE LEADERS AND LAGGARS

Stocks below are ranked by Barchart based on the Highest Daily Percentage Change. 

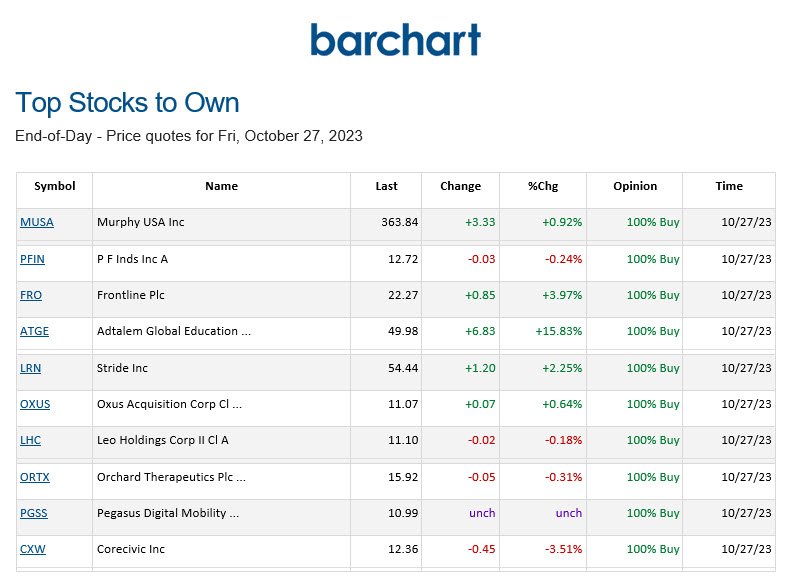
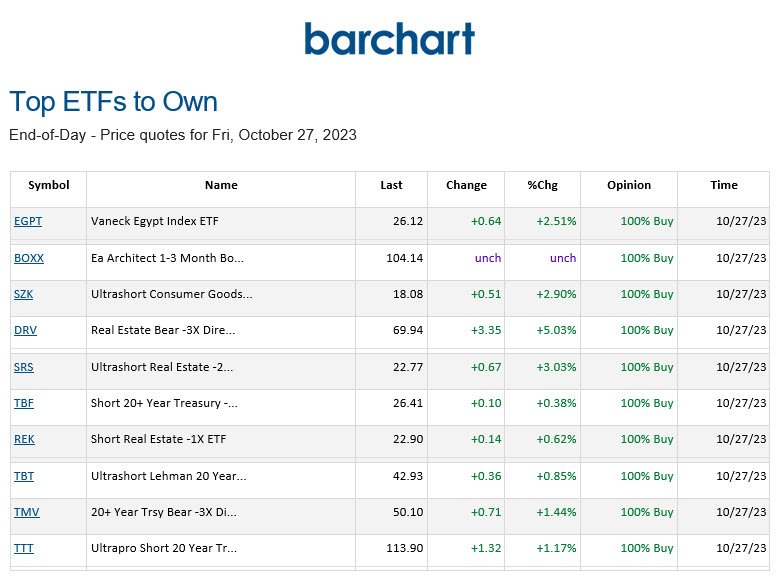
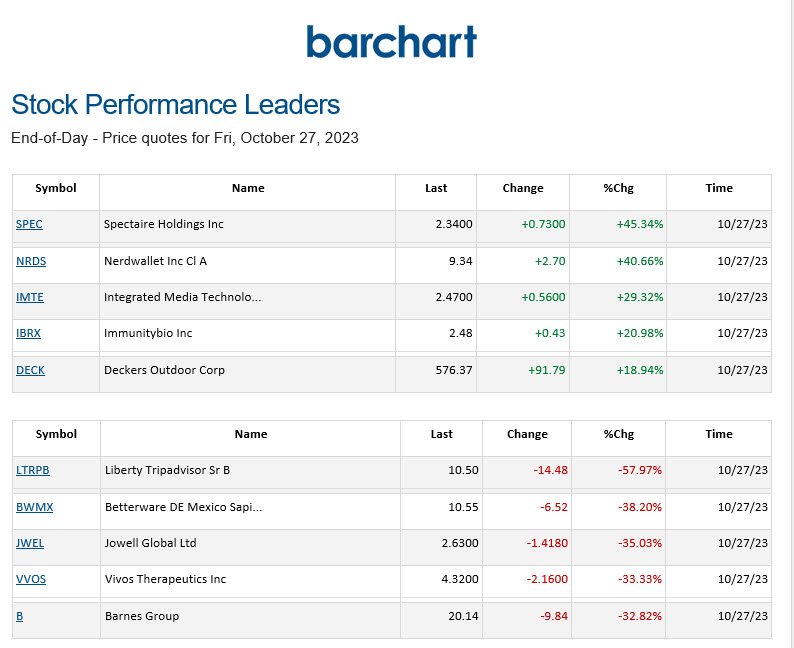
The charts used in this Blog Post are from Barchart. Barchart is a financial data and technology company that provides financial market data, news, analysis, and trading solutions. 

PLEASE CLICK THE LINK TO THE DISCLAIMER

2 Responses

  1. My brother recommended I might like this blog.

    He used to be totally right. This publish
    truly made my day. You cann’t consider simply
    how so much time I had spent for this information! Thanks!

Leave a Reply

Your email address will not be published. Required fields are marked *

Share this post
Table of Contents

U.S. stocks indexes are approaching correction territory

Latest Posts
META (META)
META (META)

FINSCREENER SUBSCRIBE TO FINSCREENER PLEASE CLICK THE LINK TO THE DISCLAIMER DISCLAIMER

Read More
GOOGLE (GOOGL)
GOOGLE (GOOGL)

FINSCREENER SUBSCRIBE TO FINSCREENER PLEASE CLICK THE LINK TO THE DISCLAIMER DISCLAIMER

Read More
Last Video
Last videos
Written by
Warren William

Warren William

Meet the author behind Smartest-Data. Warren William has a career in Finance and Investments extending over 35 years, both on the Buy Side and Sell Side. His most recent roles include, developing Institutional Risk Management Programs for managing Equity and Fixed Income Risk.  Prior to this Warren William work in Alternative Investments, in Investment Management and as a Buy Side Equity Analyst. Warren William brings a wealth of knowledge and expertise to the table, providing in-depth analysis and commentary on the latest trends in the Stock Markets. Contact information: wwBLOG@smartest-data.blog or Telegram +393339034488

Welcome to
Smartest-Data

Smartest Data aims to be your go-to source for analysis and commentary on Investments, Personal Finance and the Global Stock Markets. The aim is to provide our readers with insightful and actionable information for independent minded Investors.  Dissecting  the daily avalanche of Data produced by the Stocks Market by using data Websites  and Apps available to people at home. Join us, to be Driven by Data to navigate the Investment universe markets and make better informed investment decisions.