THE DEBT-CEILING DEBATE WEIGHTS ON STOCKS
Yesterday the Debt-Ceiling Debate forced the direction of stocks. The QQQ (NASDAQ 100) down -1.28% Nasdaq 100 Index, and the SPY minus -1.12%. These are the main ETFs based on the major U.S. indexes.
As the debt-ceiling talks continued without resolution, they dragged the U.S. stock markets down. The President and House Speaker McCarthy continued to talk, but the resulting comments gave little hope. The speaker declared they where not anywhere near close. The U.S. Treasury Secretary has continued to warn the U.S will run out of funds in early June.
U.S. stock markets also likely felt the impact of a drop in European stocks. An unexpected fall in manufacturing output weighed on the markets. Around the world the stock markets closed down on Tuesday. The Euro Stoxx 50 fell -0.99%, Shanghai Comp. down -1.52% Nikkei fell -0.42%
Global bond yields were mixed on Tuesday. In the U.S. the 10-year T-note are yielding 3.70%. In Europe the 10-year German bund is yielding 2.47% and the UK 10-year gilt is 4.16%.
Subscribe to
Stock IDEA: Nabors Industries (NBR) 
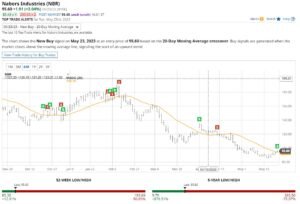
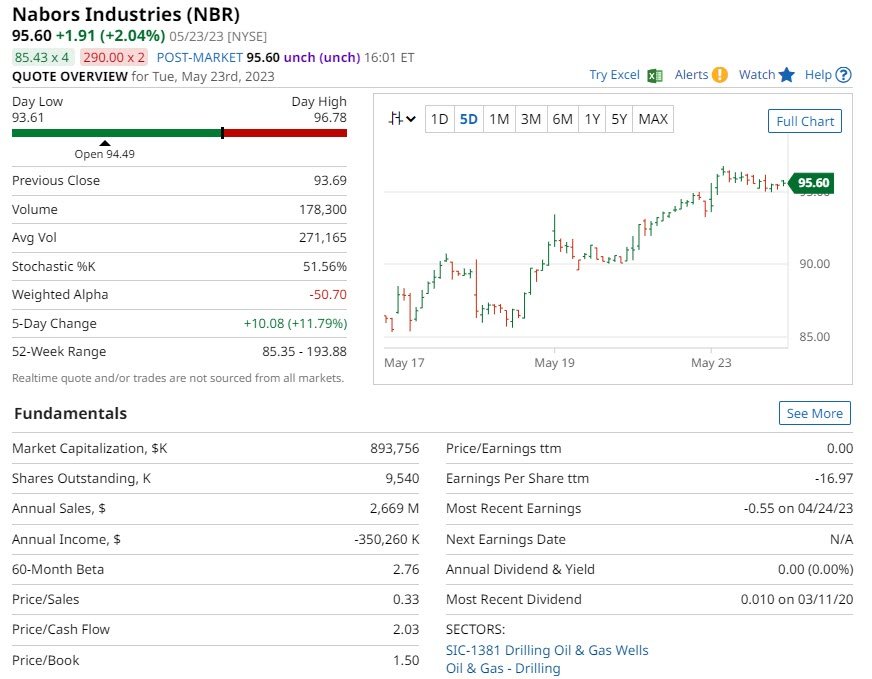
The stock NBR’s 20-Day MAV indicated a Buy Signal, with an Entry Price of $95.60.
Over the past 5-Years, a Buy signal on 20-Day Moving Average for NBR has resulted in an upside of +448.76% compared to a 5-Year market gain on the stock of -75.49%. The Signal gain is based on 59 trades, where the trades lasted an average of 15 days.

Nabors Industries Ltd. is one of the largest land-drilling contractors in the world. NBR has operations in oil, gas, and geothermal land drilling operations across countries. It has an ownership in Saudi Arabia named Nabors Arabia. NBR has 4 major segments: U.S. Drilling, International Drilling, Drilling Solutions & Rig Technologies.

Investment ideas from 30 million users. Invest in 3,000+ assets on a trusted and friendly platform.
77% of retail investor accounts lose money when trading CFDs with this provider
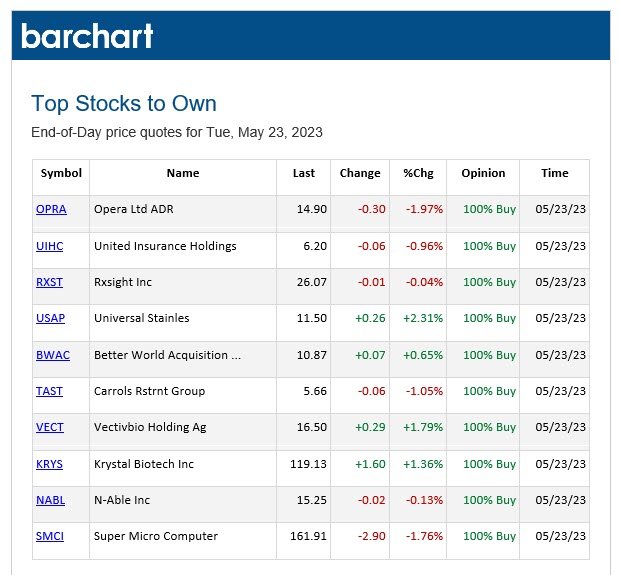
BARCHART: TOP STOCKS TO OWN

PRICE SURPRISES AND VOLATILITY
24 May. Barchart lists Price Surprises both upside and downside. Volatile stocks, as indicated by standard deviation the past 20 days of data.

STOCK PERFORMANCE LEADERS AND LAGGARS
Stocks below are ranked by Barchart based on the Highest Daily Percentage Change. Ranked for both gains and losses. ![]()

![]()
The charts used in this Blog Post are from Barchart. Barchart is a financial data and technology company that provides financial market data, news, analysis, and trading solutions. The website is designed for individual traders and investors, as well as institutional clients, including banks, brokers, and hedge funds.


