HOW TO INVEST IN STOCKS
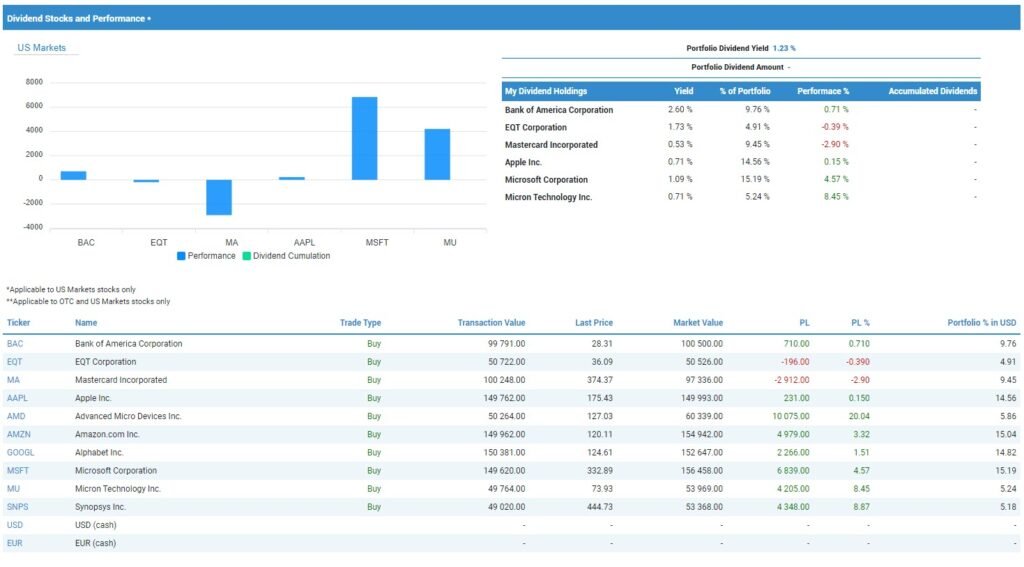
Since launching Portfolio 18, for the week ending on 19 May the performance is down 5.6%. With all constituent stocks recording positive performance, except for Mastercard, to date. Constructing a portfolio is an effective way to track your stock investments.
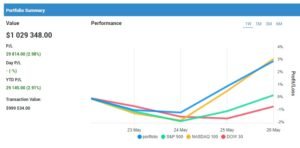
The key to its success will be to find a quick, easy-to search or screen for stocks. For this Portfolio, the CNBC Halftime Report, is the main source. Created on a weekly basis, the portfolio reviews the stocks discussed in Final Trades. In the segment Final Trades, a panel of professional investment managers discuss stocks.
The intention of the portfolio is to be a stock picker’s portfolio, providing a range of stock ideas. The stocks selected will often come from the selected stocks by the panelists. The inclusion of other stocks will be by the investment profile of the stock. Sometimes the panel may recommend broad sector or geographic exposure. Thus, the inclusion of ETFs can occur at a 5% weighting.up 2.9%
SUBSCRIBE TO FINSCREENER
PORTFOLIO CONSTRUCTION: 10 STEP PROCESS
The portfolio construction process is a straight-forward 10 step process.
Select individual stocks to be included. U.S stocks, selectively ETFs.
Measure the market cap of the stocks in the portfolio.
Aggregate individual market cap for a total market cap of the portfolio.
By market cap, calculate percentage contribution for each stock, ETFs 5%.
Estimate the individual allocation for each stock.
Mega cap 15%, Large cap 10%, Mid-cap 5%, EFTs 5%.
The initial allocation is a proforma (not real) amount of $1,000,000.
Based on the initial investment, calculate the allocation to each stock.
Determine the number of shares. Allocation divided by share price.
Construct the portfolio in Finscreener under “my portfolios”.
![]()
CNBC - FINAL TRADES

How to Invest in Stocks: Portfolio 18 – 05/19/23
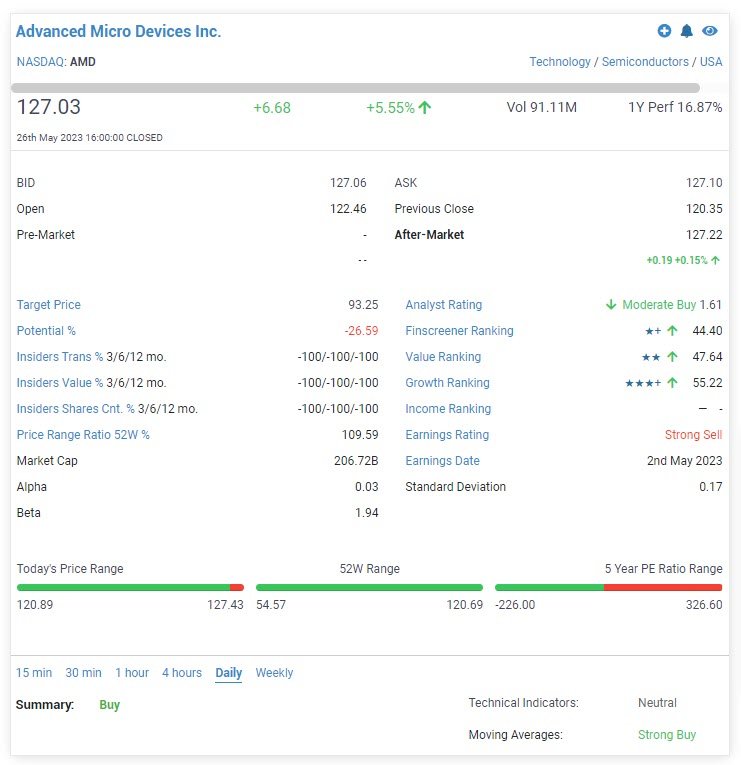
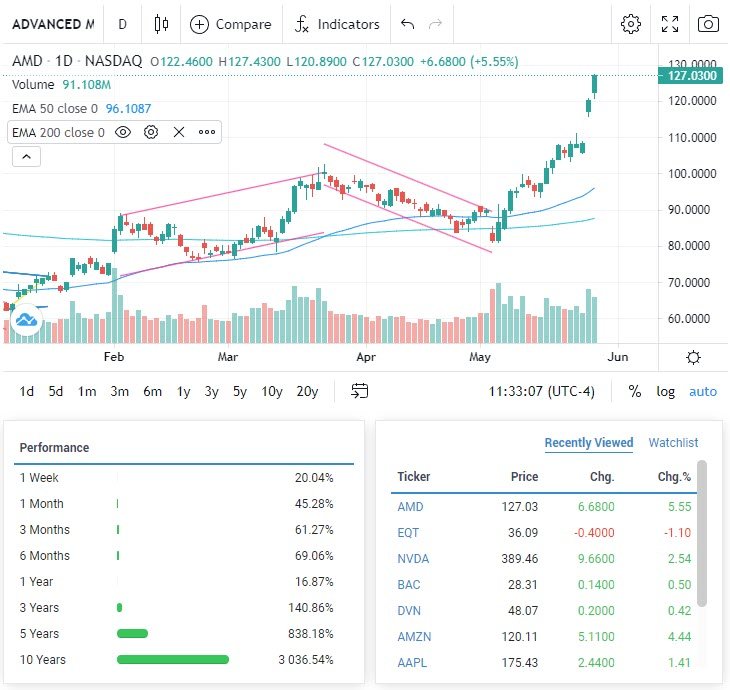
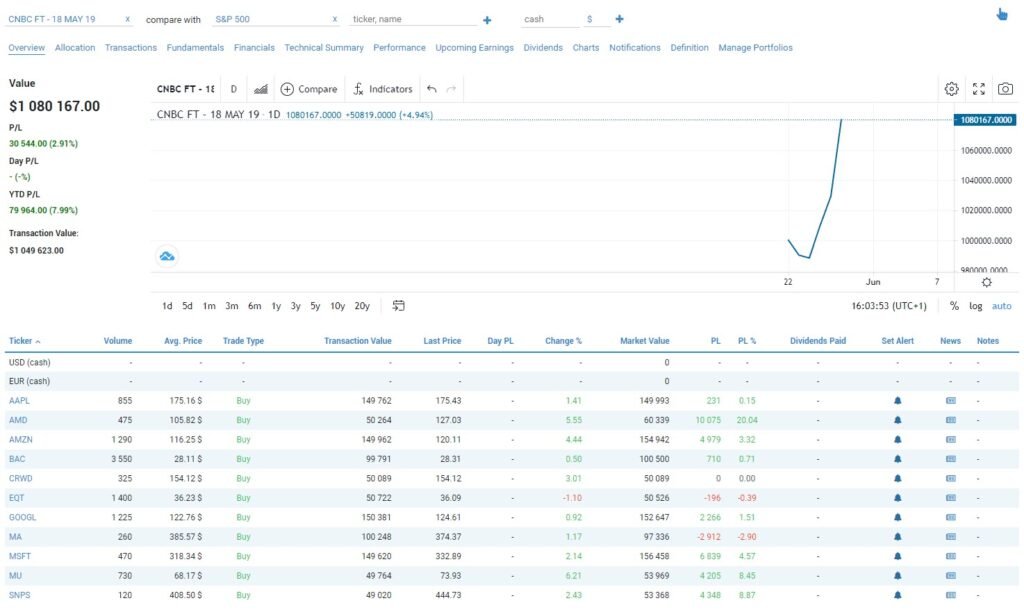
The portfolio has a limited number of stocks, 10 in total. The stocks selected for Portfolio 18 came from discussion in the week ending 19 May. As mentioned above, nearly all stocks have been positive to date. Since inception the portfolio is up 2.9% until today. The best performer was AMD, up 20%. Two other stocks, MU and SNPS, performed well up over 8%.
For more information on semiconductor stocks in the NASDAQ, click HERE.
How to Invest in Stocks: Asset Allocation
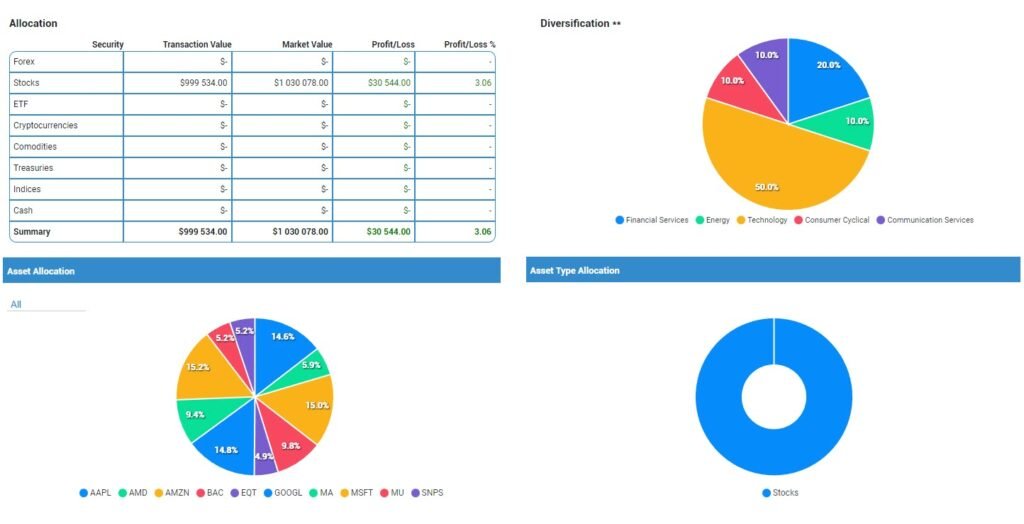
Portfolio 18 is concentrated in Technology at a 50% weighting. The news issued by Nvidia last week rallied the Nasdaq Index and the S&P 500. The semiconductor stocks are in the spotlight. The growth in Data Centers, needed for AI could lead to a long cyclical upside in Semi stocks.
 The Finance sector has a 20% allocation. The other three sectors all had a 10% allocation. There were no allocations to ETFs. Healthcare is a defensive sector, and there are no allocations to healthcare. The continued talk of a recession has diminished, the Fed seems more Dovish, but still a 25% of a rate hike in June.
How Invest in Stocks: Price Potential
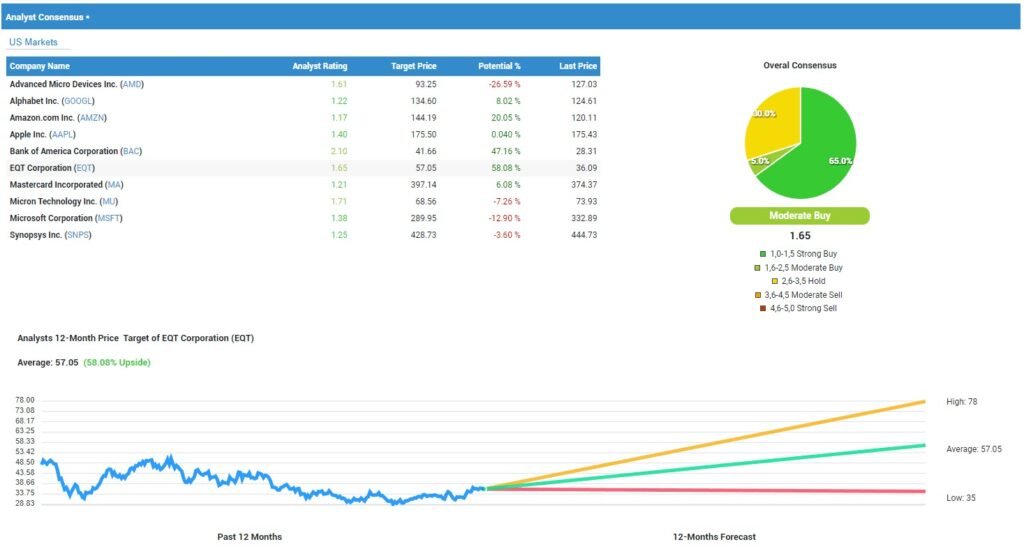
The Consensus Graph measures the suggested investment strategy as per analyst recommendations. Analysts following the stocks, will propose an investment strategy; Buy, Hold, Sell. The consensus price potential of the Price Targets, follows the analyst’s targets.

The stock rated with the greatest potential upside, at 58% is EQT Corporation (EQT). To date, the stock’s performance is down 16%. On the Consensus graph, 65% of the EQT recommendations are Strong Buy and 30% are Hold.
STOCK: HIGHEST POTENTIAL UPSIDE
EQT Corporation (EQT)
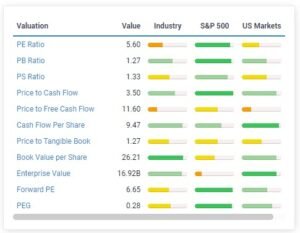

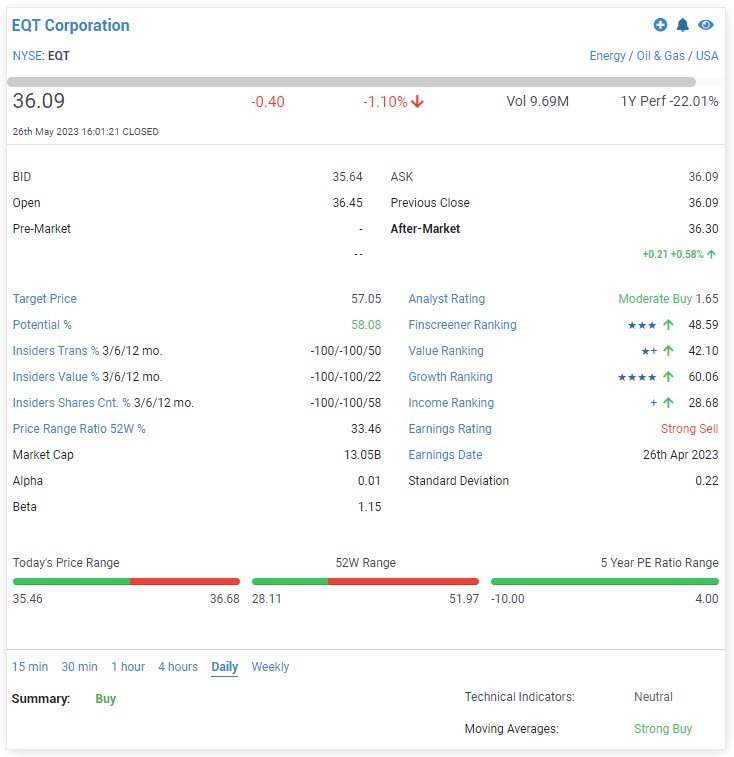
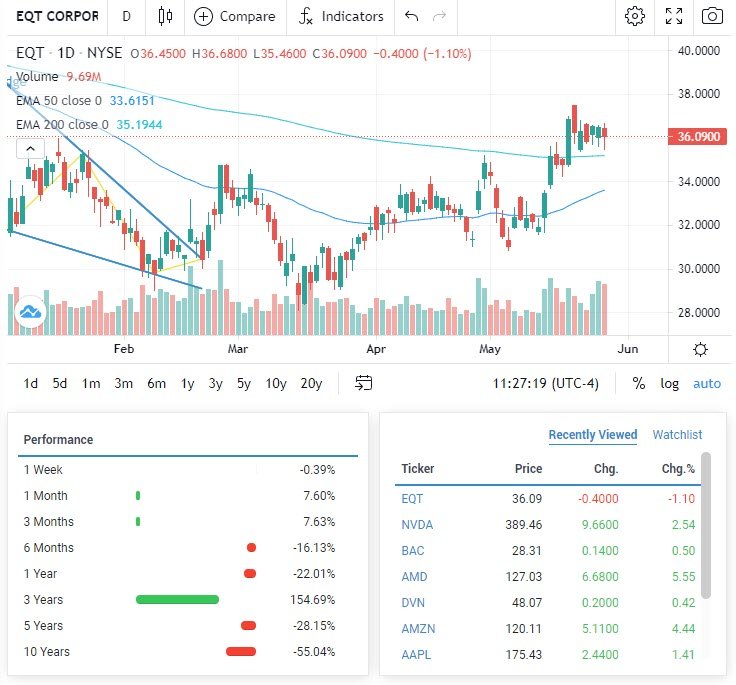
Finscreener is a powerful financial analysis tool that allows investors and traders to screen and analyze stocks, ETFs, mutual funds, and cryptocurrencies based on various fundamental and technical criteria quickly and easily. The platform provides users with a wide range of filters, charts, and tools to help them find and analyze the right investment opportunities.
SUBSCRIBER TO FINSCREENER, CLICK BELOW
How to Invest in Stocks: Dividends and performance
The key aspects to analyse are the current Dividend Yield and performance contribution. Dividend yields and price activity can both contribute to a stock’s return. The average split is around 33% yield, 66% capital appreciation. Dividend yield is the annual dividend payment divided by the stock price. It denotes the earnings earned by a stock, expressed as a percent.

Price action, relates to a stock’s price fluctuation over time. A stock’s price will move in line with supply and demand from investors. Aspects taken into consideration include financial position, industry developments, and macroeconomic conditions.
The portfolio has a current Dividend Yield of 2.0%. The highest dividend yielding stock in the portfolio is The Carlyle Group (CG) yielding 4.0%. The second highest dividend yielding stock is Principal Financial Group yielding 2.9%. The best performing stock over the period was Goldman Sachs, down 0.11%.
STOCK: BEST PERFORMANCE
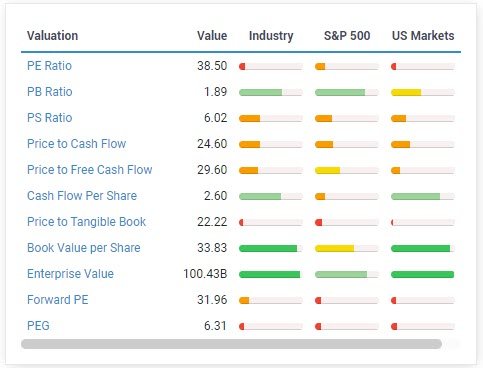
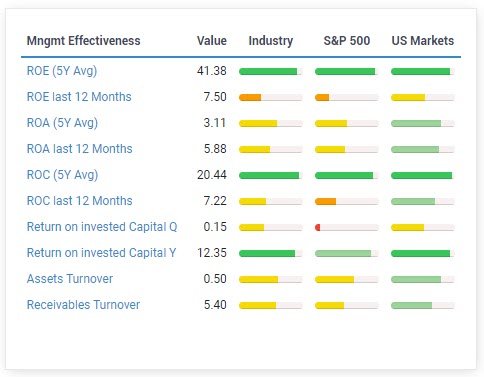
ADVANCED MICRO DEVICES (AMD)
