
5 reasons to consider investing in High dividend-yielding Stocks.
After the collapse of Silicon Valley Bank, concerns have surrounded the Bank Sector. Investors seeking dividend yielding stocks have seen the sector as a “hunting ground”. Of course, for investors seeking yield, they always have other sectors such as Utilities.
Stocks with high dividend yields may not be suitable for all investors. One key sensibility is that these stocks can be more sensitive to interest rate changes. Dividend Investors will continue the hunt for the highest dividend yield stocks. To include high yield stocks in their portfolios could do so for a variety of reasons.
A Regular Income:
High dividend yielding stocks can provide investors with a consistent stream of income. Investors who own stock in a company that pays a high dividend can receive a regular cash payout. This can be key for investors that need to supplement their income. Or they can be reinvested in the stock.
Stabile Earnings:
Common stock dividends are not guaranteed. For a company to commit to a regular dividend payment, they must establish a long track record. They must have consistent earnings and cash flow for investors to have a level of security. Predictability in dividend payments is key for Dividend Investors.
Industry Leader:
Companies that pay significant dividends are often leaders in their respective industries. These companies have a solid and well-established business base in their respective industries. A stable business leads to stable earnings. These are factors to become a high dividend yield stock.
Capital Appreciation:
High dividend yielding stocks can provide long-term capital appreciation. The primary driver will be growth in its earnings. Investors can benefit from a higher share price as well as dividend payments.
Defensive Sectors:
High yielding dividend stocks are often found in the defensive sectors. These include Utilities, Food and Pharmaceuticals. As is often the case, these sectors may not have the same level of growth potential as other sectors. Even so, they often offer price stability during periods of market turmoil. For more information about dividend investing as a strategy, click HERE.

7 Highest Divided Yielding Stocks


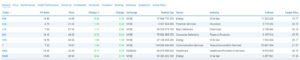
Altria Group Inc. (MO) Yield 8.2%
Is one of the world’s leading producers and marketers of tobacco, and associated items. The company’s core business is the manufacturing and sale of tobacco products. This includes cigarettes, cigars, and smokeless tobacco. It also has a wine business and owns a 10 percent stake in global beer giant Anheuser-Busch InBev. Altria’s major cigarette brands include Marlboro, Parliament, Virginia Slims, and Benson & Hedges. It also owns the popular smokeless tobacco brands, Copenhagen and Skoal.
Altria’s products are sold in over 150 countries worldwide. It has a significant presence in the United States, with a market share of around 50% of the cigarette market. The company employs over 8,000 people and had revenues of $25.4 billion in 2021.
Valuation
The one-year performance of Altria Group Inc. stock is -18%, YTD -3.11%. MO stock has a five-year performance of -29.08%. Its 52-week range is between $40.35 and $57.05. MO stock a 52-week price range ratio of 23.59%. Altria Group Inc. currently has a PE ratio of 18.10X, a price-to-book (PB) ratio of 25.24X, a price-to-cashflow ratio of 10.20X, a PEG ratio of 2.32. The stocks ROA of 13.89%, and a ROE of -176.65%. The company’s profit margin is 19.70%, the EBITDA margin is 40.30%, and its EPS is $8.71.
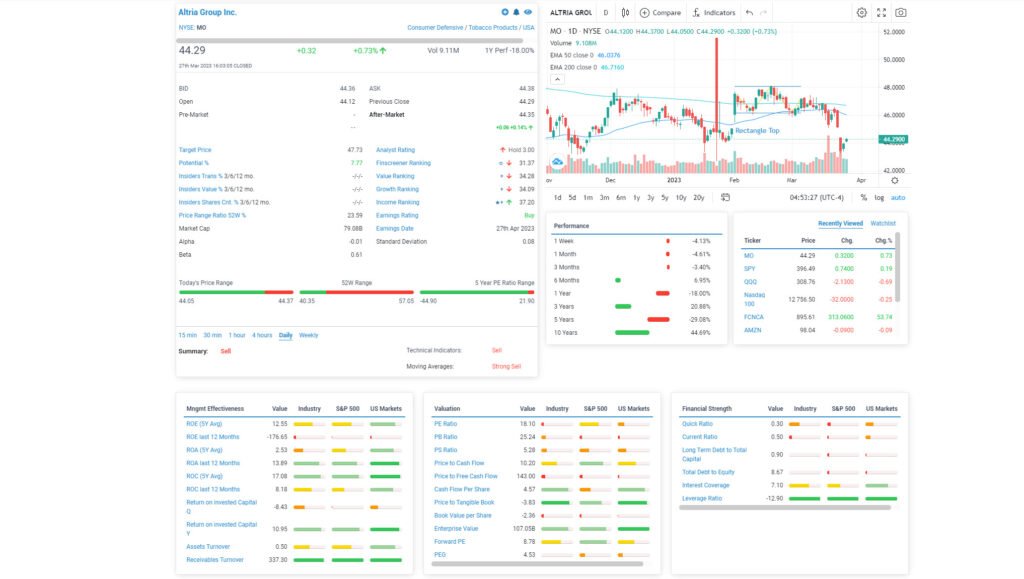
Kinder Morgan, Inc. Yield 5.9%
Kinder Morgan, Inc. is a publicly traded energy infrastructure company based in Houston, Texas. The company owns and operates a diverse portfolio of midstream energy assets. This includes pipelines, terminals, and storage facilities. KMI transports and store natural gas, crude oil, and refined petroleum products. The company has an extensive network of pipelines that spans over 83,000 miles. This connects the major shale and natural gas production areas in North America. Kinder Morgan’s terminals include bulk, liquids, and rail terminals. They handle a variety of commodities, including gasoline, diesel fuel, jet fuel, ethanol.
Valuation
The one-year performance of Kinder Morgan Inc. stock is -11.96%, YTD -6.58%. KMI stock has a five-year performance of 14.04%. Its 52-week range is between 15.775 and 20.2, which gives KMI stock a 52-week price range ratio of 25.20% The current PE ratio is 16.90X, a price-to-book (PB) ratio of 1.36X, a price-to-sale (PS) ratio of 2.88. A price to cashflow ratio of 8.70X, a PEG ratio of 2.32. An ROA of 3.88% and a ROE of 8.84%. The company’s profit margin is 13.21%, its EBITDA margin is 31.90%, and the current EPS is $6.50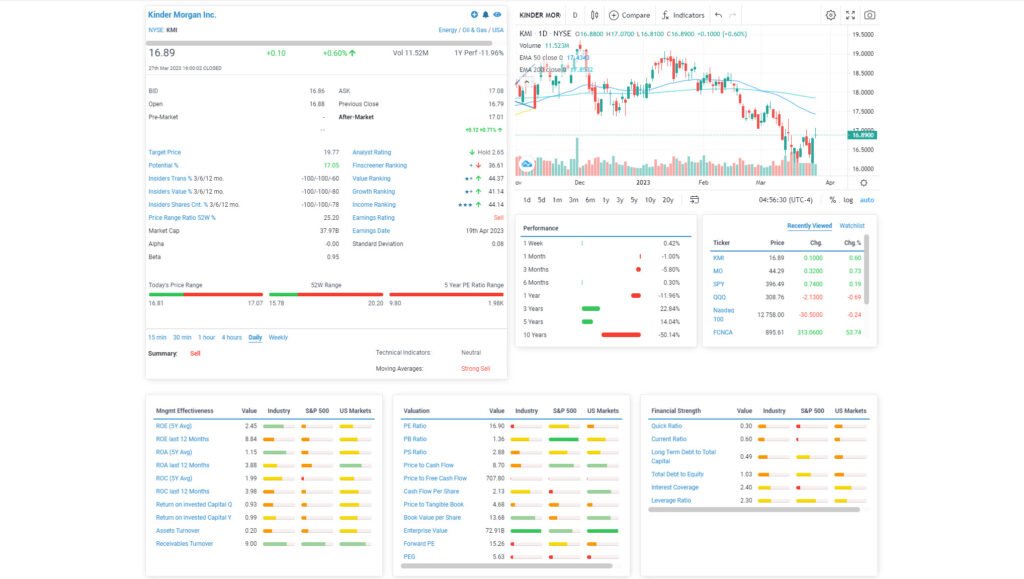
Lincoln National Corporation (LNC) Yield 5.8%
Lincoln National Corporation (LNC) is a financial services firm based in Radnor, Pennsylvania. Created in 1905, it is divided into four primary segments. Annuities, life insurance, retirement plan services, and group protection. Lincoln National has a robust distribution network. Group services are marketed through independent agents, financial advisors, and intermediaries.
The annuities industry provides fixed and variable annuities, providing a guaranteed income source. The life insurance segment offers life insurance policies, term life, and universal life. The retirement plan services industry provides employer-sponsored plans. Individual investors will have access to retirement savings plans such as 401(k)s and 403(b).
Valuation
YOY, the stock is down -68.76%, while year-to-date, -31.58%. LNC stock has a five-year performance of -70.81%. Its 52-week range is between 19.74 and 69.91, which gives LNC stock a 52-week price range ratio of 2.77%
Lincoln National Corporation had revenues of $17.3 billion and is trading on a price-to-book (PB) ratio of 2.44X. The company has suffered losses. The ROA is -0.63%, and an ROE of -19.98%. The company’s profit margin is -15.17%.
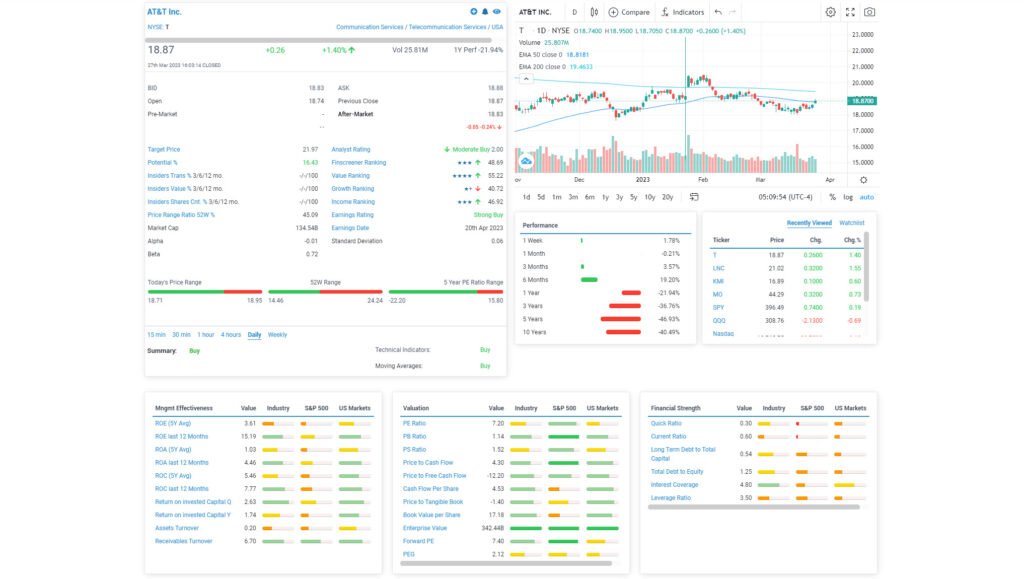
AT&T Yield 5.8%
Is a telecommunications corporation based in Dallas, Texas. The group offers wireless connectivity, high-speed internet, entertainment, and digital advertising. AT&T’s wireless communication has 168 million users for both voice and data services.
Through its fiber optic and satellite networks, it provides internet and television services. Thus, clients will have access to high-speed internet and streaming TV services. AT&T’s entertainment division includes Warner Media. It is the owner of several major media companies, including HBO, Warner Bros., and CNN.
Valuation
AT&T Inc. YOY is down 20.95%, YTD up 2.5%. Over the past 5 years, the stock is down -46.93%. The 52-week price range is from $14.46 to $24.24, giving it a 45% 52-week price range ratio.
AT&T Inc has total revenues of $170.8 billion. The current PE ratio is 7.20X, a price-to-book (PB) ratio of 1.14X, a price-to-sale (PS) ratio of 1.52X. The price to cashflow ratio is 4.30X. AT&T ROA is 4.46%, and a ROE of 15.19%. The company’s profit margin is 18.01%, its EBITDA margin is 34.30%, and an EPS $12.54.
ONEOK Inc Yield 5.5%
ONEOK Inc. is headquartered in Tulsa, Oklahoma, and is a natural gas midstream service provider. Its operations in natural gas and natural gas liquids processing, storage, and transportation. ONEOK is divided into two business segments. Natural gas gathering and processing and natural gas liquids (NGLs). ONEOK owns and maintains a 38,000-mile network of pipelines and processing facilities. The combined processing capacity is more than 2 billion cubic feet per day. It owns NGL fractionation facilities and a storage capacity of 100 million barrels.
Valuation
Total revenues of $10.9 billion, while YOY ONEOK Inc. Is down 14.61%, YTD performance is -7.67%. OKE stock has a five-year performance of 9.04%. Its 52-week range is between 50.5 and 75.07, which gives OKE stock a 52-week price range ratio of 42.37%. The PE ratio is 18.50X, a price-to-book (PB) ratio of 4.71X, a price-to-sale (PS) ratio of 1.74X. The price to cashflow ratio of 10.20X. The ROA is 7.23%, and a ROE of 28.70%. The company’s profit margin is 7.13%, its EBITDA margin is 15.10%, EPS is $38.83.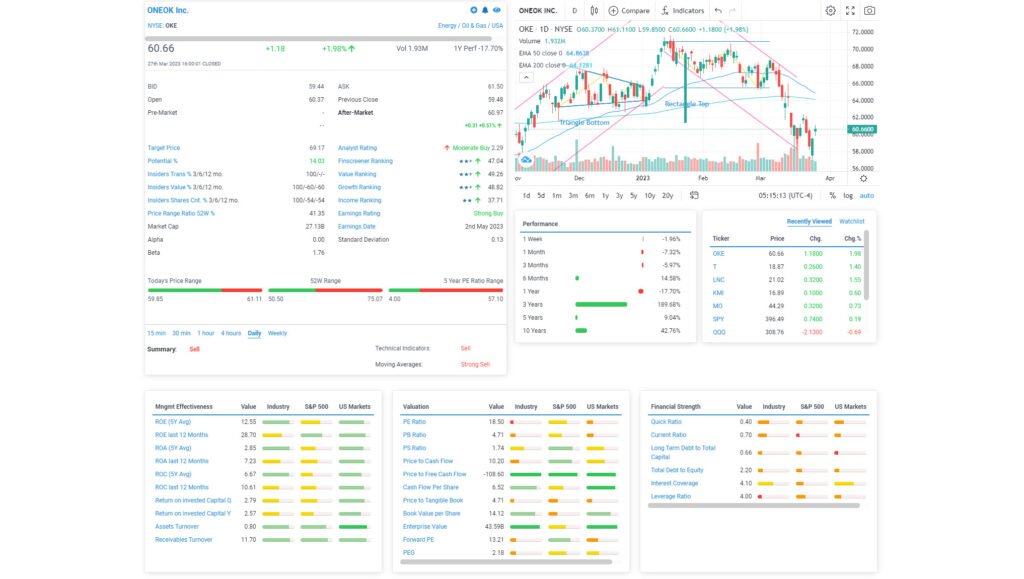
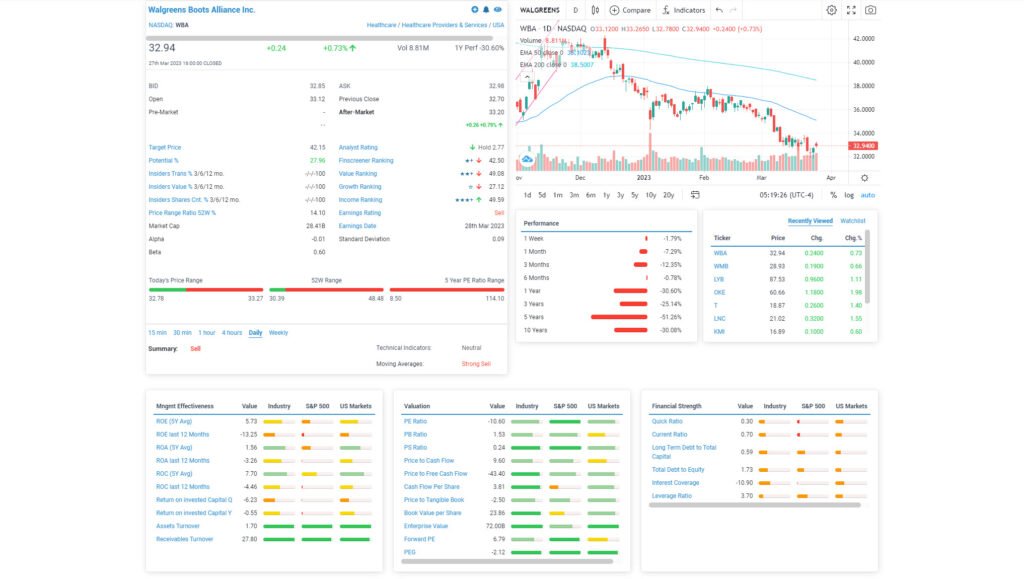
Walgreens Boots Alliance Yield 5.3%
Walgreens Boots Alliance Inc. is a multinational healthcare corporation with operations in over 25 countries. WBA offers a variety of pharmacy, health & wellness, and retail products. The company was founded in 2014 and is based in Deerfield, Illinois. The business is divided into three major areas. Pharmaceutical Wholesale, Retail Pharmacy USA, and Retail Pharmacy International.
Walgreens and Duane Reade locations operate under the Retail Pharmacy USA segment. The group provides prescription and over-the-counter drugs. Also, health and wellness goods, and other retail items are available. Retail Pharmacy International has locations in several countries, including Boots in the UK. The Pharmaceutical Wholesale division supplies to hospitals, clinics, and pharmacies.
Valuation
YOY WBA down 30.2%, YTD is -11.83%. WBA stock has a five-year performance of -51.26%. Its 52-week range is between 30.39 and 48.48, which gives WBA stock a 52-week price range ratio of 19.85%. The price-to-book (PB) ratio of 1.53X, a price-to-sale (PS) ratio of 0.24X, a price to cashflow ratio of 9.60X. The ROA of -3.26%, and an ROE of -13.25%. The company’s profit margin is -2.24%, its EBITDA margin is -2.00%, WBA lost money over the previous FY.
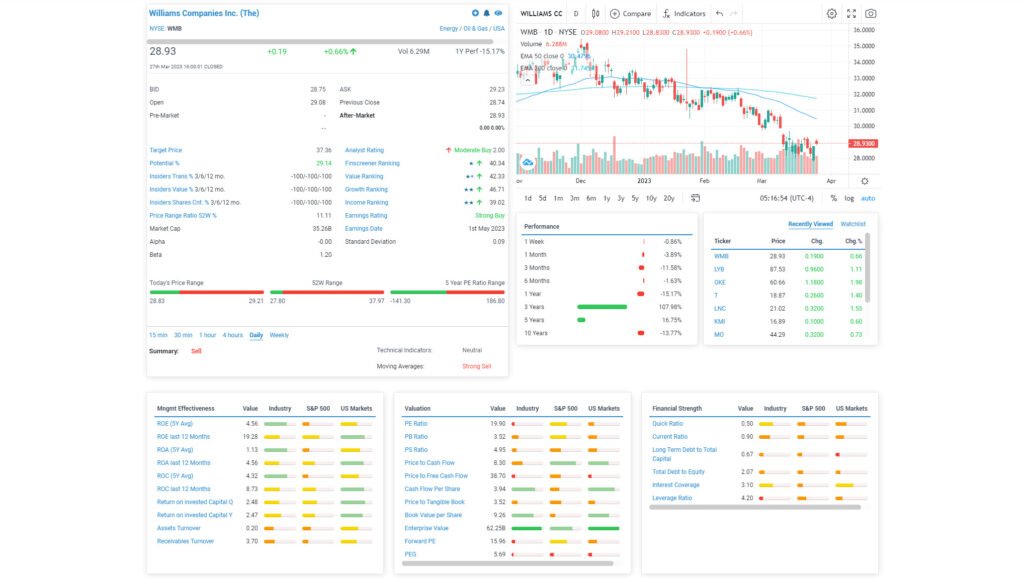
Williams Companies Yield 5.2%
Williams Companies Inc. is an American natural gas infrastructure firm headquartered in Tulsa, Oklahoma. It is a natural gas infrastructure corporation with two primary business sectors. Williams Partners and Williams NGL & Petchem Services are two companies. The emphasis on responsible and sustainable operations, delivering services to the gas industry. With activities across the United States. The Williams Partners business focuses on natural gas transportation and storage. The pipeline network of the corporation stretches over 30,000 miles. Williams Partners managers, a natural gas processing plants and storage facilities. These are vital to the natural gas sector.
Valuation
YOY Williams Companies Inc. down 13.12%, YTD -12.07%. WMB stock has a five-year performance of 16.75%. Its 52-week range is between 27.8 and 37.97, which gives WMB stock a 52-week price range ratio of 10.08% The current PE is 19.90X, a price-to-book (PB) ratio of 3.52X, a price-to-sale (PS) ratio of 4.95X. The price to cashflow ratio of 8.30X. The ROA of 4.56%, and an ROE of 19.28%. The company’s profit margin is 17.67%, its EBITDA margin is 49.00%, and EPS is $6.60.
.
DISCLAIMER
The various forms of media that I produce, the videos, blog posts and courses I teach have been made for the purpose of providing information. Information delt with is about the stock market and personal and business finance. The objective in developing the website www.smartest-data.blog and the videos is to provide you the viewer with some insight into general investing and the stock markets. As the viewer, if for your private investments, you gain some insight into what could be driving the valuations in stock markets, individual stocks and other investments, this is your interpretation.
Investment Advisor
While I am registered as an Investment Advisor in Switzerland under FINMA, a registered Investment Advisor in Ireland under the Central Bank of Ireland. In the past, under the FCA in the United Kingdom, I am not currently practicing in this capacity. Most importantly, I am not your Investment Advisor, nor is the website www.smartest-data.blog or www.smartest-data.com or www.smartest-data.courses acting as your Investment Advisor. Therefore, the objective of the publications is for the purpose of increasing your level of knowledge. Hopefully, the information provided could become part of your overall investment decision and due diligence. No investment advice is provided, nor are any investment products distributed via the websites. Some examples of investment products will be used and stocks will be discussed. The purpose of the website, the videos is to be informative educational, and hopefully to be mildly entertaining in order to keep your interest.
All rights reserved
No part of this video or the information held on the website can be reproduced with the express written permission of Smartest Data. The information contained here may not be suitable for your individual situation and it is always recommended that you consult with your Investment Advisor. Neither Smartest Data nor the producer of this video can be held liable for any investment decisions that you make.
By engaging in the material, you have agreed and understood the terms and conditions described above.