
Stock trading, technical indicators and market timing

Identifying the dominant trend allows investors to adjust their trading tactics accordingly.
THE DIFFERENT CALCULATIONS USED IN STOCK TRADING
In stock trading, there are several methods used to calculate the different technical indicators. The various indicators use different computations to generate insights into market trends. These trends can be in momentum, or volatility, or other pertinent factors. In many of the technical indicators the variables used can be adjusted.

This would be done to increase or decrease the sensibility of the indicator. This will force the indicator to focus more on the short term or medium term. The Stochastic indicator has various sub indicators. For example, one is called Stochastic fast, and another is Stochastic slow. They focus on different time horizons.
Which one is best?
This depends on your investment horizon and trading frequency. Only the investor or trader can determine this.
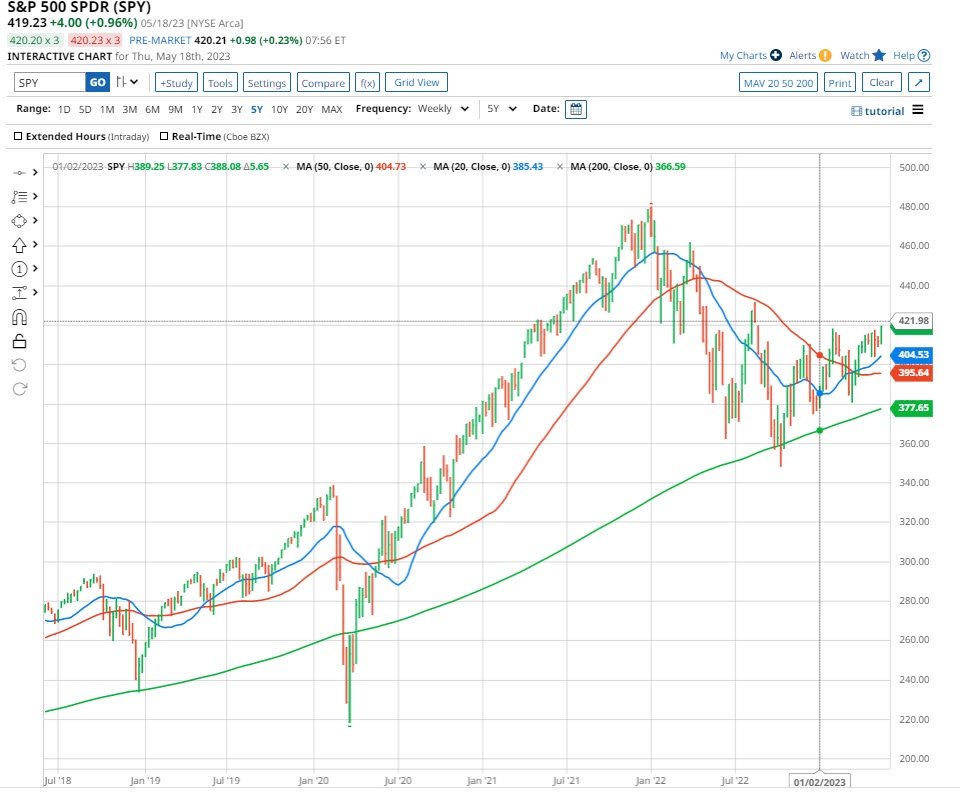
USING MOVING AVERAGES IN STOCK TRADING
Moving averages (MAs) are probably the most common technical indicator used. They are trend-following indicators that smooth out price data over time. The simplest type is the Simple Moving Average (SMA). The Exponential Moving Average (EMA) weights current prices more heavily, making it more responsive to recent market fluctuations.

Thus the simple Moving Average is the average of the past n data points, unweighted. A 10-day moving average of closing prices, for example, is the mean of the preceding 10 days’ closing prices. This is calculated by the following formular.
![]()

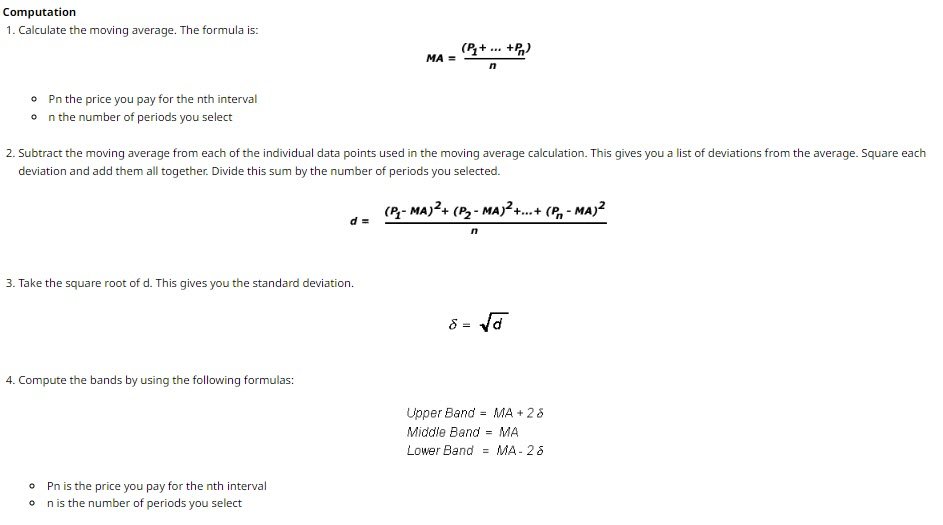
Thus the average price is calculated by adding the closing prices over the number of periods. For example 10-days in a 10 Day MA. This total is then divided by the number of periods. When calculating successive values, a new value comes into the sum and an old value drops out. Therefore a new calculation, the full summation and division is required each time. This is calculated by the following formula.
![]()

![]()
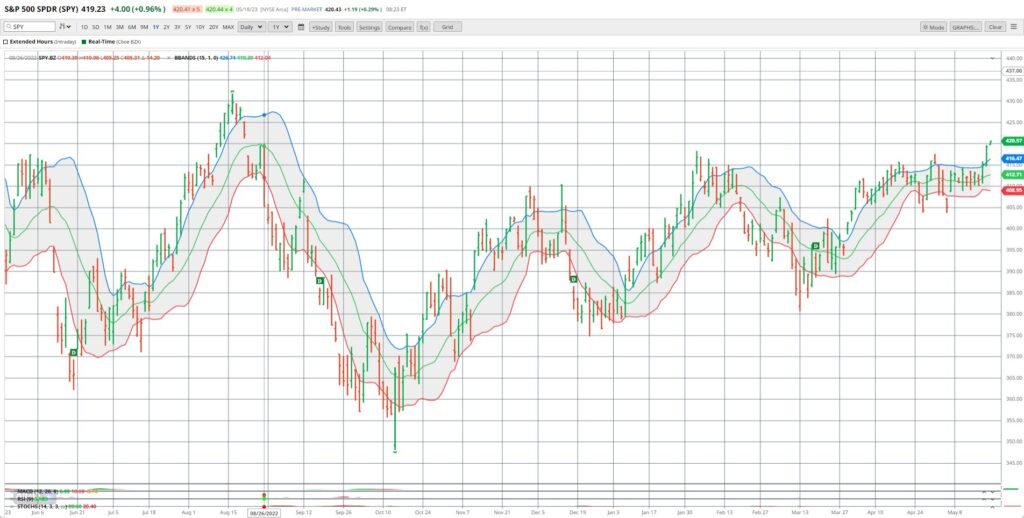
The charts used in this Blog Post are from Barchart. Barchart is a financial data and technology company that provides financial market data, news, analysis, and trading solutions. The website is designed for individual traders and investors, as well as institutional clients, including banks, brokers, and hedge funds.
Barchart provides users with access to real-time and historical data on a wide range of financial instruments. Included are stocks, futures, options, currencies, and cryptocurrencies. The website also offers a variety of tools and services for trading and investing. Customizable charts, technical indicators, and screeners for identifying potential investment opportunities.
In addition to its data and trading solutions, Barchart provides news and analysis on the financial markets, with articles and commentary from a team of experienced financial journalists and analysts.
Overall, I find Barchart to be a comprehensive platform for traders and investors looking to stay up-to-date on financial market data and news. Provides access a range of tools and services to support a wide range of investment strategies.
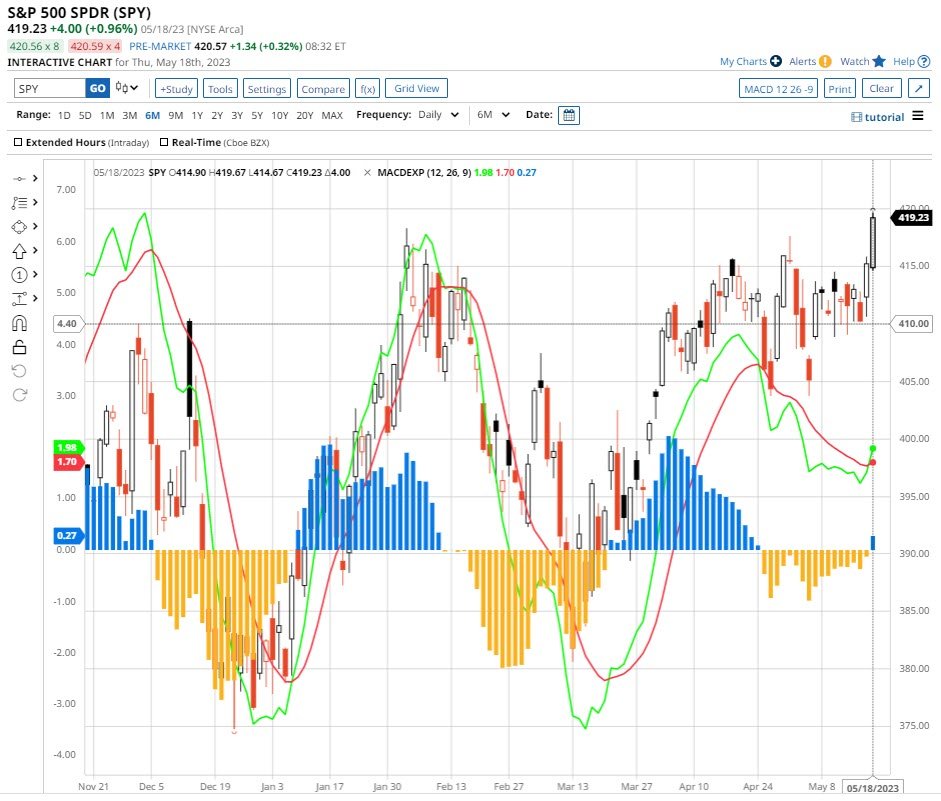
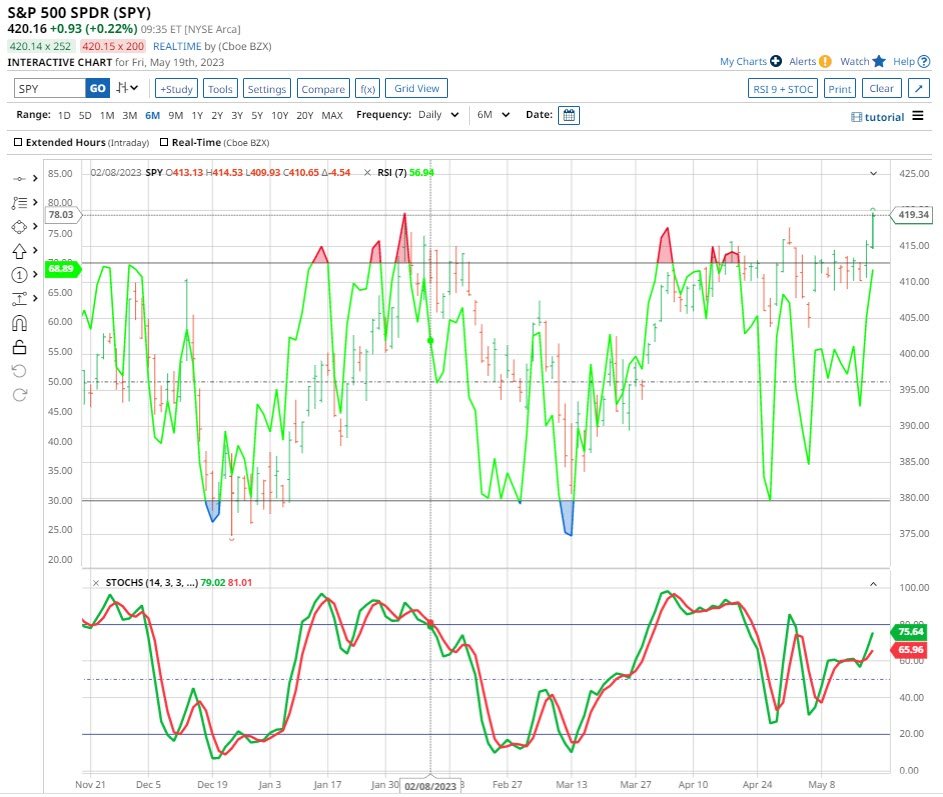
Stochastic Oscillator
The Stochastic Oscillator is a momentum indicator. This compares a stock’s closing price over a specific time period to its price range. The computation comprises determining the position of the closing price within the price range. Then calculating a percentage value. Values greater than 80 indicate overbought conditions.

While values less than 20 suggest oversold conditions. It is based on the observation that as a stock’s price rises, daily closes tend to be closer to the higher end of the recent price range. In contrast, as prices fall, daily closes tend to be closer to the lower end of the recent price range.
The slow stochastic study (the full stochastic) generates two lines. As does the standard stochastic study. They are a percentage of K and a percentage of D. Overbought and oversold zones are seen in the standard stochastic. The overbought zone is set at 80 and the oversold zone at 20. Other possibilities are 75 and 25.

There are three primary stochastic values:
Raw stochastic – the most basic value representing the stochastic value for each period. Also known as raw K.
%k – the first smoothing of the raw stochastic, usually with a 3-period simple moving average.
%d – the smoothing of the %k value, usually with another 3-period simple moving average. Also known as slow K.
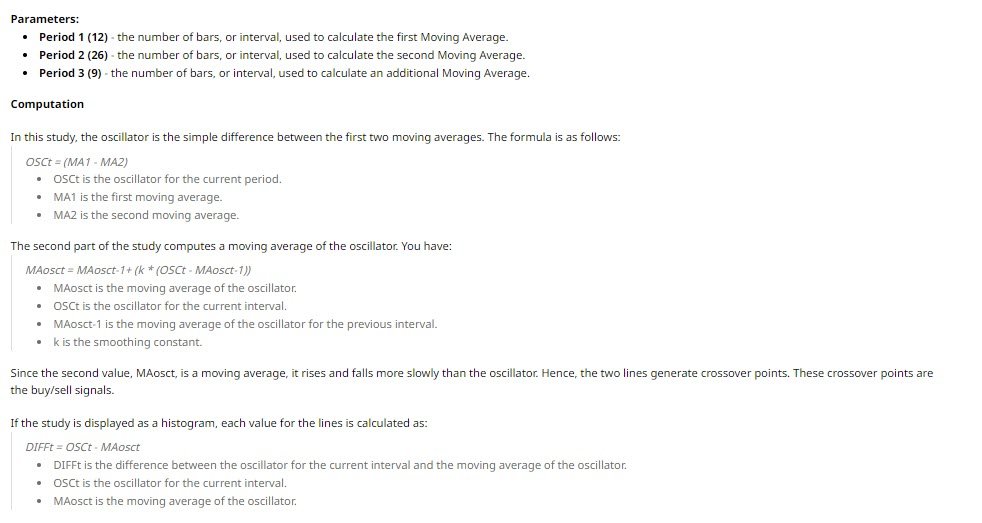
There are three parameters for stochastics:
The number of periods over which the raw stochastic is calculated (14).
The smoothing factor for the calculation of %K and %D (3).
The type of moving average used in the smoothing. (MA)
CONCLUSION


2 Responses