smartest-data blog

NASDAQ Index is booming, 3 highest dividend yielding stocks

The NASDAQ 100 Index is booming

Investors continue to flock back into the NASDAQ 100 Index. What is driving this? Are concerns about rising interest rates and a potential recession, receding? The market has taken a turn. These factors could be bringing cash back into stocks. The current Interest Rate Cycle may soon peak. Blue-chip tech companies are coming back into fashion. Economic growth could slow, but a recession is avoided. Fears of missing out on the rally in the NASDAQ index may also be part of the story.

To test your knowledge on this blog, DO THE QUIZ click HERE.

CAPEX V DIVIDENDS

Let’s take a look at the highest dividend stocks in the NASDAQ 100 Index. Due to a high CAPEX spend, Tech Stocks are generally not high dividend yielding stocks. Tech Stocks have lower Payout Ratios, DPS/EPS. They choose to build Retained Earnings, reinvesting their profits back into the business. Fueling growth and innovation, a strong driver of their share price.

Tech stocks must continue to develop new products and services. The sectors and sub-sectors in the Tech Industry are very competitive. Investing in research and development is key to staying competitive in these industries. Their end goal is to expand market share.

INDEXES ARE BOOMING +20%

Tech stocks are booming, up over 20% since the low in November. Liquidity is driving the NASDAQ Index 100. Over the past month, 10-year bond yields have dropped around 35bps. Is QE back? The restructuring that Tech companies have done, has dramatically improved their business. They are leaner, less staff, and low debt levels will see them through an economic recession. If one eventually occurs, I have my doubts. 

The Invesco QQQ ETF could reach new highs over the next 12 months.

nasdaq index
nasdaq index
Finscreener is a powerful financial analysis tool that allows investors and traders to screen and analyze stocks, ETFs, mutual funds, and cryptocurrencies based on various fundamental and technical criteria quickly and easily. The platform provides users with a wide range of filters, charts, and tools to help them find and analyze the right investment opportunities.
how to invst in stocks
SUBSCRIBER TO FINSCREENER, CLICK BELOW

The macro environment remains very challenging, but the bet could pay off. The Invesco QQQ ETF is one of the best vehicles to gain diversified exposure to the NASDAQ.

nasdaq index

The 3 highest dividend yielding stocks in the NASDAQ 100 Index

Some investors in the NASDAQ 100 Index prefer to invest in individual equities. Dividend yield can be key, and below I will discuss the three highest dividend paying stocks. The return for Tech stocks, and all stocks, is both capital appreciation and dividend yield. The growth in the value of the stock price is capital appreciation. Several variables can contribute to an increase in the stock price.  Factors to consider are earnings growth, investor demand, and macroeconomic conditions.

High dividend yielding stocks in the Tech Sector are relatively uncommon. There are a Tech companies that do have relatively high dividend yields. They tend to be more mature Tech businesses with a robust business model.

The important ratios and factors to consider in analysing high dividend yielding stocks. For more information regarding dividend investing as a strategy, click HERE.

Dividends Yield:

The dividend is the company’s distribution of profits to its shareholders. As a result, the corporation can handle it a little better. The dividend declared is decided by the Board.

The most fundamental of all ratios is calculated as follows:

Dividend Yield = Dividend per share / stock price. The Dividend Yield is expressed as a percentage.

Traders from all around the world use online trading to benefit from the world’s largest and most liquid markets, trading up to $6 Trillion per day.
Due to innovations in technology investors and traders can now invest in a range of securities. Forex, Commodities, Energies, Indices & Stocks, easily to trade with FX PRIMUS at the click of a button.

Dividend coverage:

This is a financial ratio that assesses a company’s ability to pay dividends out of earnings. A dividend coverage ratio above 1 indicates earnings cover the dividend paid. A ratio less than 1 means that earnings are not enough to support the dividend paid. The dividend coverage ratio for NASDAQ index tech companies is as follows:

Earnings per Share (EPS) / Dividend per Share = Dividend Coverage Ratio (DPS)

Payout Percentage:

The pay-out ratio is the percentage of earnings distributed to shareholders as dividends. A lower pay-out ratio suggests that the company keeps more earnings for reinvestment. A higher pay-out ratio is when a company pays a greater part of its earnings as dividends. The payout ratio is the inverse of the above ratio:

Dividend per Share (DPS) / Earnings per Share (EPS) = Payout Ratio (EPS)

Policy on dividends:

The Board of Directors determines a company’s dividend policy. The Board will establish the criteria and processes for calculating dividend distributions. The frequency and amount of dividend payments are important considerations. Some tech companies have a more conservative dividend policy. They choose to pay a lower long-term pay-out. Other tech companies may have a more aggressive dividend strategy. They pay a bigger part of the profits as dividends.

Economic situation:

The state of the economy might also influence a company’s choice to pay a dividend. During a recession, a corporation may decide to save money. As a result, they either reduce the dividend or do not pay one. Once the economy improves, this should be reviewed, and the dividend payments reinstated.

Competition:

The dividend policies of a firm in the NASDAQ 100 index might also have an impact on its dividend pay-out. If a competitor pays a greater dividend, a company may feel compelled to raise its own dividend. 

Financial results:

The most essential aspect impacting dividend pay-out is the company’s financial performance. A tech company that generates regular earnings, will often pay dividends. They have the financial capacity to pay out a dividend. On the other hand, a company struggling to make profits, may not have the profitability to pay a dividend.

nasdaq index

Prospects for expansion:

An early stage tech company, investing in the business may choose to reinvest the profits.  The corporation may decide that continuing to invest in R&D or expanding into new areas is a better use of profits. 

A tech company’s choice to pay a dividend and the amount of the pay-out will be determined by a number of criteria. Including financial performance, growth prospects, dividend policy, market conditions, and competition.

The 3 Stocks

nasdaq index

Graphs and data by Finscreener

HOW TO INVEST IN STOCKS

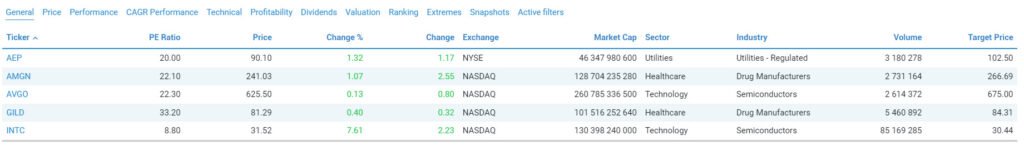
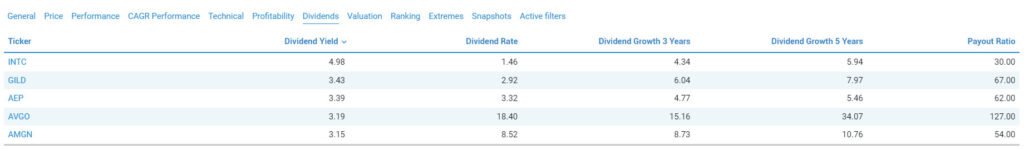
INTEL (INTC) Yield 5.0%

Intel is one of the world’s largest semiconductor chip makers, with a market capitalization of around $224 billion as of March 30, 2023. It is a major player in the semiconductor industry, with a wide range of products used in computers and electronic devices around the world.

NASDAQ INDEX

The company’s microprocessors are used in personal computers, servers, and other devices, while its memory and storage products are used in smartphones, gaming consoles, and other electronic devices.

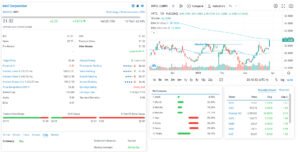
YOY Intel is down 43.94%, YTD + 19.26%. INTC stock has a five-year performance of -39.48%. Its 52-week range is between $24.59 and $52.51, which gives INTC stock a 52-week price range ratio of 24.82%. 

nasdaq index

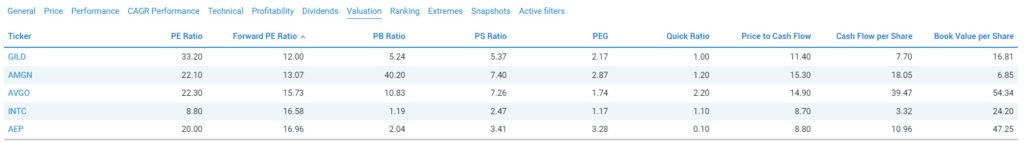
The current PE ratio 8.80X, a price-to-book (PB) ratio of 1.19X, a price-to-sale (PS) ratio of 2.47X. Price to cashflow ratio of 8.70X. The current ROA of 8.39%, and a ROE of 15.10%. The company’s profit margin is 17.71%, its EBITDA margin is 38.90%, and an EPS of $11.88.

BROADCOM (AVGO) YIELD 3.2%

Broadcom was founded in 1991 in Irvine, California. Since then, Broadcom has grown to become a multinational technology company. It produces a wide range of semiconductor and infrastructure software solutions. The products are used in various industries, including computer networking and telecommunications.

nasdaq index

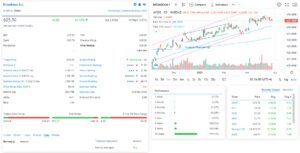
As well as data centers, enterprise software, and mobile devices. Broadcom operates in more than 30 countries around the world.

YOY Broadcom is -2.61%, YTD + 11.87%. AVGO stock has a five-year performance of 165.44%. Its 52-week range is between $415.06 and $648.50, which gives AVGO stock a 52-week price range ratio of 90.15%. The current PE ratio is 22.30X, a price-to-book (PB) ratio of 10.83X, a price-to-sale (PS) ratio of 7.26X.  

nasdaq index

Price to cashflow ratio of 14.90. ROA is 16.28%, and a ROE of 50.94%. The company’s profit margin is 34.69%, its EBITDA margin is 56.90%, and an EPS $79.45

Gilead Sciences (GILD) Yield 3.43%

GILD is a biopharmaceutical company. It was established in 1987 and is based in Foster City, California. GILD creates and commercialises novel treatments to treat a wide range of diseases. Gilead Sciences is recognised for viral illness therapies, HIV, hepatitis B – C, COVID-19.

nasdaq index

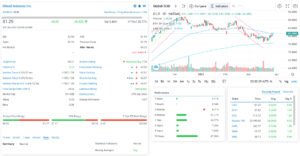
Gilead Sciences received international notice in 2020 for their antiviral medication Remdesivir. It was granted authorisation by the United States FDA for the treatment of COVID-19.

YOY Gilead Sciences Inc. is UP 36.26%, while YTD -5.31%. GILD stock has a five-year performance of 7.83%. Its 52-week range is between $57.16 and $89.74, which gives GILD stock a 52-week price range ratio of 74.77%. Gilead Sciences Inc. current PE ratio is 33.20X, a price-to-book (PB) ratio of 5.24X, a price-to-sale (PS) ratio of 5.37X.

nasdaq index

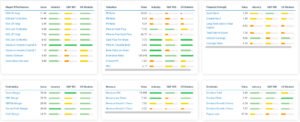
Price to cashflow ratio is 11.40X. The ROA of 5.58%, and a ROE of 16.98%. The company’s profit margin is 14.74%, the EBITDA margin is 28.00%, EPS is $15.86.

PLEASE CLICK THE LINK TO THE DISCLAIMER

3 Responses

Leave a Reply

Your email address will not be published. Required fields are marked *

Share this post
Table of Contents

NASDAQ Index is booming, 3 highest dividend yielding stocks

Latest Posts
META (META)
META (META)

FINSCREENER SUBSCRIBE TO FINSCREENER PLEASE CLICK THE LINK TO THE DISCLAIMER DISCLAIMER

Read More
GOOGLE (GOOGL)
GOOGLE (GOOGL)

FINSCREENER SUBSCRIBE TO FINSCREENER PLEASE CLICK THE LINK TO THE DISCLAIMER DISCLAIMER

Read More
Last Video
Last videos
Written by
Warren William

Warren William

Meet the author behind Smartest-Data. Warren William has a career in Finance and Investments extending over 35 years, both on the Buy Side and Sell Side. His most recent roles include, developing Institutional Risk Management Programs for managing Equity and Fixed Income Risk.  Prior to this Warren William work in Alternative Investments, in Investment Management and as a Buy Side Equity Analyst. Warren William brings a wealth of knowledge and expertise to the table, providing in-depth analysis and commentary on the latest trends in the Stock Markets. Contact information: wwBLOG@smartest-data.blog or Telegram +393339034488

Welcome to
Smartest-Data

Smartest Data aims to be your go-to source for analysis and commentary on Investments, Personal Finance and the Global Stock Markets. The aim is to provide our readers with insightful and actionable information for independent minded Investors.  Dissecting  the daily avalanche of Data produced by the Stocks Market by using data Websites  and Apps available to people at home. Join us, to be Driven by Data to navigate the Investment universe markets and make better informed investment decisions.